
Technical Analysis: Understanding Market Patterns
Technical analysis has shaped investment decision-making for over a century, providing traders and investors with systematic methods to evaluate securities and forecast future price movements. By examining historical price data, volume patterns, and chart formations, market participants attempt to identify trends and opportunities that might otherwise remain hidden. This analytical approach stands as one of the foundational disciplines in financial markets, complementing fundamental analysis and offering unique insights into market psychology and behavior patterns that have repeated across different eras and economic cycles.
The Foundation of Technical Analysis
The principles underlying technical analysis rest on three core assumptions that have guided practitioners since the early 20th century. First, market prices discount all available information, meaning that all fundamental factors, economic conditions, and investor sentiment are already reflected in current prices. Second, prices move in trends that persist over time, allowing analysts to identify and follow these directional movements. Third, history tends to repeat itself, particularly in terms of market psychology and participant behavior.
Technical Analysis of Stock Trends established many foundational concepts that continue to influence modern practitioners. These principles emerged from decades of observation and documentation of market movements, creating a framework that transcends individual securities or market conditions.
Key Assumptions in Practice
Understanding how these assumptions translate into practical application reveals the discipline's strengths and limitations:
- Price reflects everything: Economic reports, corporate earnings, geopolitical events, and investor psychology all manifest in price movements
- Trend persistence: Once established, trends typically continue until clear reversal signals emerge
- Pattern recognition: Similar chart formations appear across different time periods and markets
- Volume confirmation: Price movements accompanied by higher volume carry greater significance
The interplay between these assumptions creates a comprehensive framework for market analysis. When examining historical market data, patterns emerge that demonstrate remarkable consistency across decades, from the stock market crashes of the 1920s to modern volatility events.
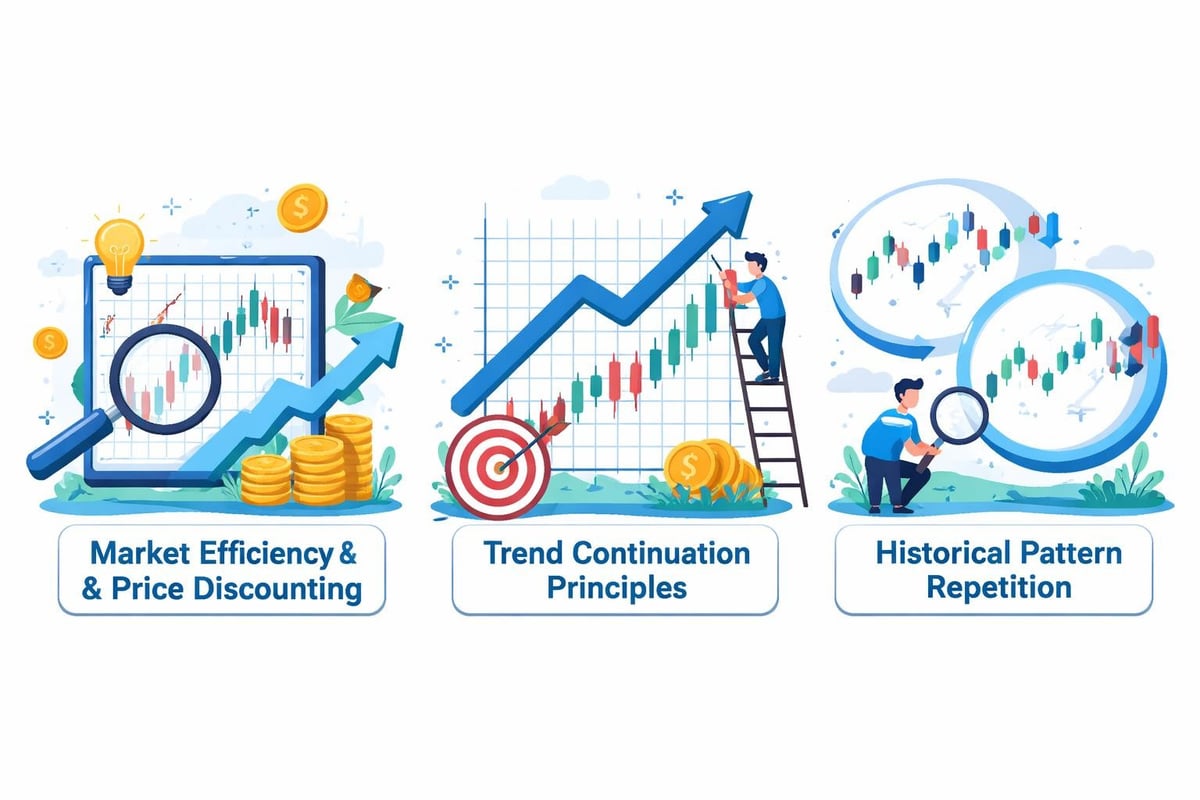
Chart Types and Their Historical Applications
Different charting methods have evolved to address specific analytical needs, each offering distinct advantages for identifying trends and patterns. Line charts provide the simplest visualization, connecting closing prices across time periods to reveal overall directional movement. Bar charts add depth by showing opening, high, low, and closing prices for each period, offering insights into intraday volatility and trading ranges.
Candlestick charts, originating from 18th-century Japanese rice trading, have become the preferred method for many modern analysts. These charts display the same information as bar charts but use color-coded bodies and wicks to make patterns more visually apparent. Point and figure charts eliminate the time element entirely, focusing solely on price movements of a specified magnitude, which proves particularly useful for identifying long-term trends and filtering out market noise.
| Chart Type | Primary Advantage | Best Use Case | Historical Origin |
|---|---|---|---|
| Line Chart | Simplicity and clarity | Long-term trend identification | Early 20th century |
| Bar Chart | Complete price range visibility | Daily trading analysis | 1900s stock markets |
| Candlestick | Pattern recognition | Short to medium-term signals | 1700s Japan |
| Point & Figure | Noise reduction | Support/resistance levels | 1890s tape reading |
Essential Technical Indicators
Indicators serve as mathematical calculations based on price, volume, or open interest data, transforming raw information into actionable signals. Moving averages represent perhaps the most fundamental indicator, smoothing price data to identify trend direction and potential reversal points. Simple moving averages calculate the arithmetic mean of prices over a specified period, while exponential moving averages weight recent prices more heavily, making them more responsive to current market conditions.
Momentum and Oscillator Tools
Momentum indicators measure the rate of price change, helping analysts identify overbought or oversold conditions. The Relative Strength Index (RSI) compares the magnitude of recent gains to recent losses, producing values between zero and 100. Traditional interpretation suggests readings above 70 indicate overbought conditions, while readings below 30 suggest oversold levels.
John Bollinger developed Bollinger Bands in the 1980s, creating a volatility indicator that adapts to market conditions. These bands consist of a middle simple moving average with upper and lower bands set at standard deviations from this average, expanding during volatile periods and contracting during quieter markets.
The Moving Average Convergence Divergence (MACD) combines multiple exponential moving averages to identify trend changes and momentum shifts. By plotting the difference between 12-period and 26-period EMAs alongside a 9-period signal line, the MACD reveals potential buy and sell signals through crossovers and divergences.
- Volume-based indicators: On-Balance Volume, Accumulation/Distribution Line, and Chaikin Money Flow
- Trend indicators: Average Directional Index, Parabolic SAR, and Ichimoku Cloud
- Volatility measures: Average True Range, standard deviation bands, and volatility indices
- Breadth indicators: Advance-Decline Line, McClellan Oscillator, and Arms Index
Pattern Recognition Through History
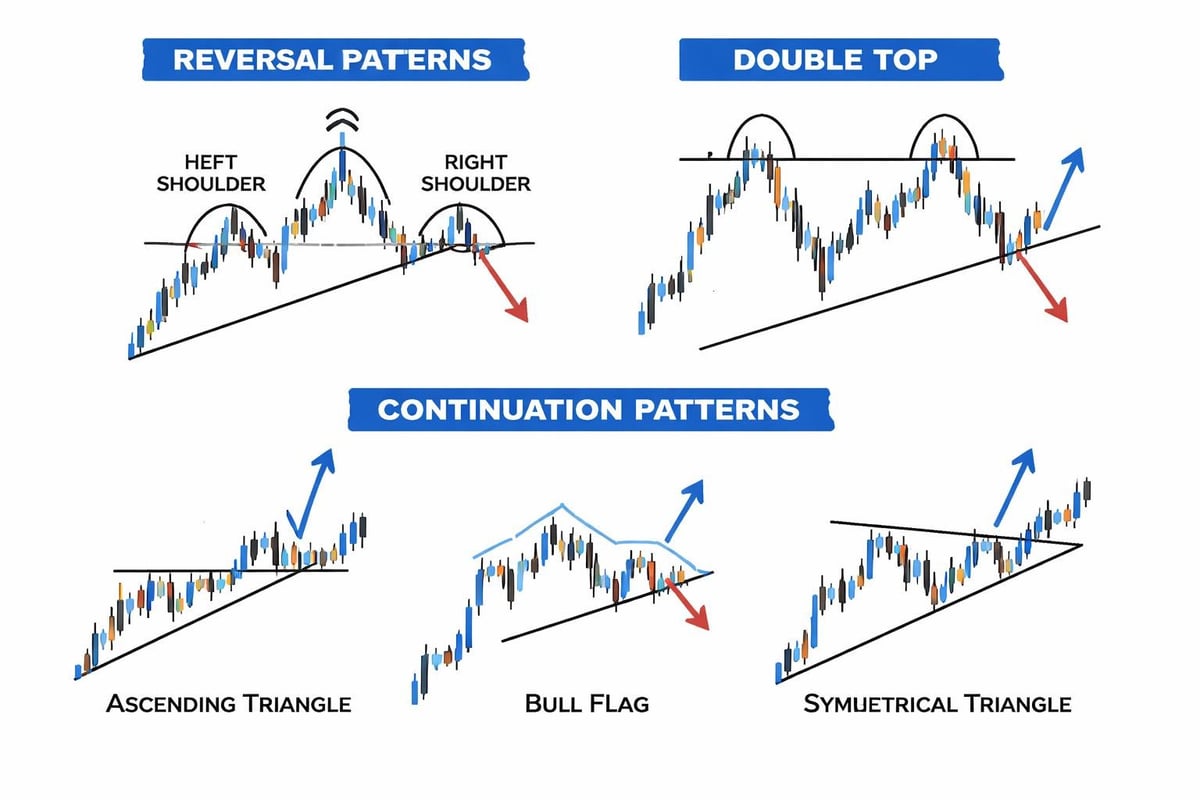
Chart patterns represent formations created by price movements that historically have led to predictable outcomes. These formations capture the collective psychology of market participants, reflecting periods of accumulation, distribution, indecision, and conviction. Reversal patterns signal potential trend changes, while continuation patterns suggest brief consolidations before the prevailing trend resumes.
Head and shoulders formations rank among the most reliable reversal patterns, featuring three peaks with the middle peak (head) rising above the outer two (shoulders). The neckline connecting the troughs between peaks serves as a critical support level whose break confirms the pattern and suggests further downside.
Double tops and bottoms represent simpler reversal formations where price tests a level twice before reversing direction. These patterns frequently appear at major turning points in market history, marking transitions between bull and bear markets or significant corrections within longer trends.
Continuation Patterns in Market Context
Continuation patterns include triangles, flags, and pennants, each indicating temporary pauses in trending markets. Ascending triangles typically form during uptrends, with horizontal resistance and rising support converging toward an upside breakout. Descending triangles show the opposite configuration, appearing in downtrends with declining resistance and horizontal support.
Rectangle patterns develop when price oscillates between parallel support and resistance levels, representing equilibrium between buyers and sellers. The eventual breakout direction often aligns with the preceding trend, though the pattern itself appears neutral until price decisively exits the range.
Support, Resistance, and Trendline Analysis
Support and resistance levels represent price zones where buying or selling pressure has historically concentrated, creating floors and ceilings for price movements. Support emerges where demand strengthens sufficiently to prevent further price declines, while resistance appears where selling pressure overcomes buying interest. These levels gain significance through repeated tests, with each successful defense strengthening their psychological importance.
When price breaks through established support or resistance, the broken level often reverses its role. Former resistance becomes new support after an upside breakout, while broken support frequently transforms into resistance during downtrends. This role reversal phenomenon demonstrates how market participants' reference points shift following significant price movements.
Trendlines connect successive higher lows in uptrends or lower highs in downtrends, providing visual representations of directional momentum. The validity of a trendline increases with each additional touch point, though most reliable trendlines contain at least three significant contacts. Understanding how trends develop across different timeframes allows analysts to identify alignment or divergence between short-term, intermediate, and long-term directional forces.
Volume Analysis and Market Participation
Volume data reveals the intensity of market participation behind price movements, adding crucial context to technical analysis. Rising prices accompanied by increasing volume suggest strong conviction among buyers, while price advances on declining volume may indicate weakening momentum. Similarly, volume spikes during price declines signal aggressive selling pressure.
The CMT Association emphasizes volume analysis as a core competency for technical analysts, recognizing its importance in confirming or questioning price-based signals. Volume patterns often precede price movements, making them valuable leading indicators for anticipating trend changes or continuations.
Volume precedes price movements in many historical market turning points. Accumulation periods before major rallies typically show increasing volume despite relatively stable prices, as informed investors build positions. Distribution phases preceding significant declines exhibit similar volume characteristics as large holders exit positions without immediately moving prices.
Multiple Timeframe Analysis
Examining charts across different timeframes provides comprehensive perspective on market conditions and trend hierarchy. Long-term charts spanning years or decades reveal primary trends and major support/resistance zones, while daily charts show intermediate-term movements within these larger patterns. Intraday charts capture short-term volatility and entry/exit timing details.
Alignment between timeframes strengthens analytical conviction. When monthly, weekly, and daily charts all display bullish characteristics, the probability of sustained upward movement increases substantially. Conversely, conflicting signals between timeframes often precede consolidation periods or trend reversals.
Timeframe Coordination Strategy
- Identify the primary trend using monthly or weekly charts
- Locate intermediate patterns on daily charts within the primary trend context
- Refine entry timing using hourly or 15-minute charts
- Confirm volume patterns across all examined timeframes
- Monitor for divergences between price action on different scales
This hierarchical approach prevents the common mistake of trading against larger trends while seeking short-term profits. Historical analysis shows that positions aligned with multiple timeframe trends typically achieve better risk-adjusted returns than trades based solely on single-timeframe signals.
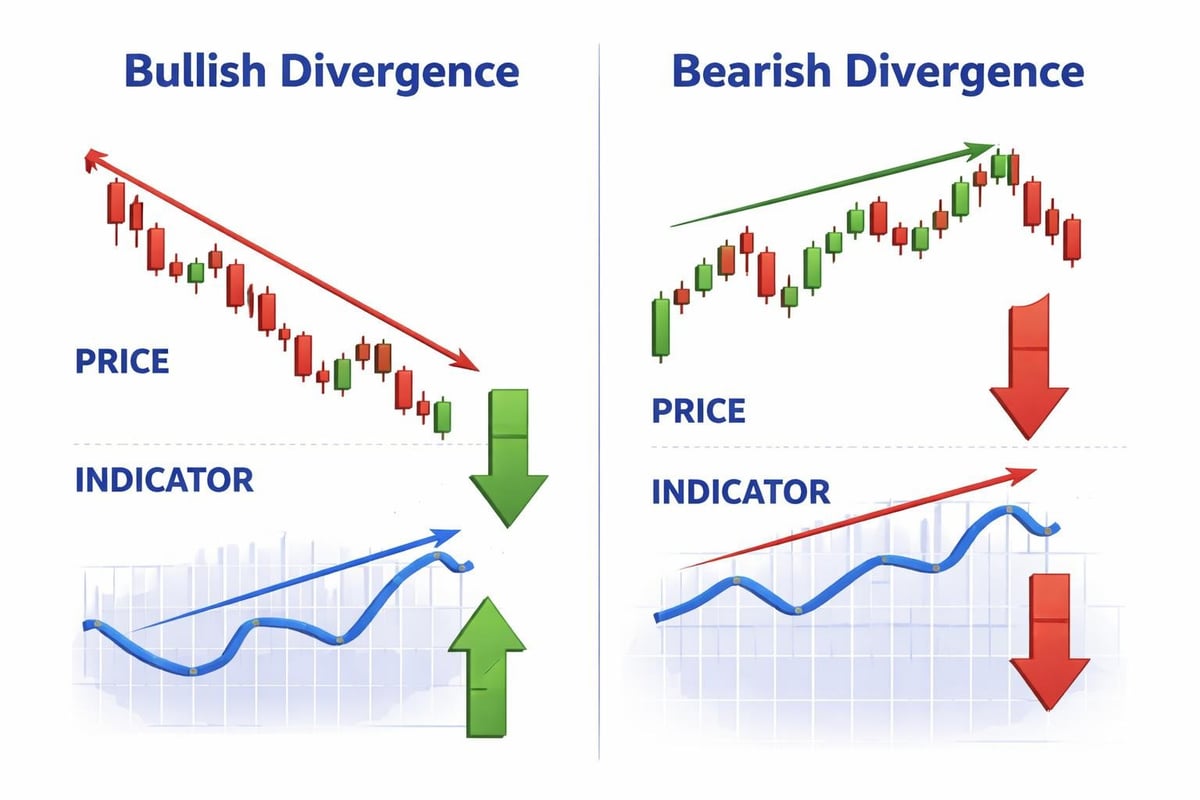
Divergence and Convergence Signals
Divergences occur when price movements and indicator readings move in opposite directions, suggesting potential trend exhaustion or reversal. Bullish divergences appear when prices make new lows while an oscillator like RSI forms higher lows, indicating weakening downside momentum. Bearish divergences show the opposite pattern, with price reaching new highs as indicators fail to confirm.
Chaikin Analytics incorporates divergence analysis into its systematic approach, recognizing these signals as valuable warnings of changing market dynamics. Historical examination of major market turning points frequently reveals divergences preceding trend reversals by days or weeks.
Convergence represents alignment between price movements and technical indicators, confirming trend strength and sustainability. When prices rise alongside increasing RSI readings, strengthening MACD histograms, and expanding volume, the combination suggests robust upward momentum likely to continue.
Applying Technical Analysis to Historical Markets
Examining technical analysis through historical events reveals both its capabilities and limitations. The 1929 stock market crash exhibited clear distribution patterns and bearish divergences that preceded the ultimate collapse, though many investors failed to recognize or act on these signals. Similarly, the 1987 crash showed extreme momentum readings and deteriorating breadth indicators before the sharp decline.
The 2008 financial crisis demonstrated how technical analysis could identify emerging risks through breakdowns of long-term support levels, widening credit spreads visible in certain commercial paper markets, and persistent negative divergences across market breadth indicators. While technical tools couldn't predict the crisis's severity, they provided warnings for those monitoring systematic signals.
Bull markets throughout history share common technical characteristics: sustained uptrends supported by rising moving averages, regular but shallow corrections to support levels, expanding volume on rallies, and positive breadth indicators. The 1990s technology boom, despite ultimately ending in a bubble, displayed these technical hallmarks throughout its advance.
Limitations and Complementary Approaches
Technical analysis faces legitimate criticisms that practitioners must acknowledge. The efficient market hypothesis argues that historical price data cannot provide exploitable advantages since markets quickly incorporate all available information into prices. Self-fulfilling prophecies represent another concern, where widely-watched technical levels influence trader behavior, creating artificial significance.
Different analysts examining identical charts may reach contradictory conclusions, introducing subjectivity into what appears as objective analysis. Pattern interpretation, trendline placement, and indicator settings all involve judgment calls that affect resulting signals. This interpretive element distinguishes technical analysis from purely quantitative approaches.
Combining technical analysis with fundamental research often produces superior results compared to either methodology alone. Understanding a company's financial health through metrics like debt-to-equity ratios and operating margins provides context for technical signals, while technical analysis offers timing guidance for positions suggested by fundamental research.
Modern Developments and Integration
Contemporary technical analysis incorporates computational power unavailable to earlier practitioners. Complex algorithms scan thousands of securities simultaneously for specific pattern formations or indicator conditions, identifying opportunities across broad market segments. TAPPS platforms demonstrate how modern software extends traditional technical analysis through enhanced data processing and statistical validation.
Artificial intelligence applications increasingly complement traditional technical methods. Recent research explores integrating Elliott Wave analysis with machine learning models, creating hybrid systems that combine pattern recognition expertise with computational pattern-matching capabilities. These developments suggest technical analysis will continue evolving while maintaining connection to foundational principles.
Volume-weighted average price (VWAP) calculations, introduced through methods like MIDAS technical analysis, represent innovations that address limitations in traditional price-based approaches. By incorporating both price and volume data into support/resistance calculations, these tools provide more nuanced views of market structure.
Educational Resources and Professional Development
Aspiring technical analysts benefit from comprehensive educational materials covering both historical context and modern applications. Technical Analysis: The Complete Resource for Financial Market Technicians provides extensive coverage of methods and their theoretical foundations, serving as a reference for both students and experienced practitioners.
Professional certification programs like the Chartered Market Technician (CMT) designation offer structured curricula and standardized competency assessment. These programs emphasize practical application alongside theoretical knowledge, preparing analysts to apply technical methods across various market conditions and asset classes.
Historical case studies provide invaluable learning opportunities by demonstrating how technical patterns and indicators behaved during significant market events. Examining charts from periods like the mid-cap stock surge of the 1990s or the commodity supercycle of the 2000s reveals pattern consistency across different market sectors and economic environments.
Risk Management Through Technical Tools
Technical analysis contributes significantly to risk management by identifying optimal stop-loss levels and position sizing parameters. Support and resistance zones suggest logical locations for protective stops, while volatility indicators like Average True Range help calibrate position sizes to current market conditions. These applications prove particularly valuable when examining historical volatility patterns across different market regimes.
Risk-reward ratios become more quantifiable through technical analysis. By measuring the distance from entry points to nearby support levels (risk) and comparing this to the potential move toward resistance or trend targets (reward), traders can evaluate whether proposed positions offer favorable risk-adjusted return profiles. Historical analysis shows that consistently maintaining favorable risk-reward ratios significantly impacts long-term performance.
Correlation analysis between different securities or sectors helps diversify technical portfolios effectively. When examining how various small-cap stocks moved during past market cycles, patterns emerge showing periods of high correlation during stress events and greater dispersion during normal conditions.
Technical analysis provides time-tested methods for understanding market behavior through price patterns, volume dynamics, and momentum indicators that have demonstrated consistency across different historical periods. By examining how markets moved during past crises, rallies, and transitions, analysts gain perspective that complements real-time decision-making. Historic Financial News empowers investors, students, and researchers to explore these patterns through interactive historical charts and AI-powered analysis, connecting technical principles to actual market events across decades. Understanding technical analysis within its historical context transforms chart reading from abstract pattern recognition into informed interpretation of market psychology and participant behavior.