
Yield to Maturity: Understanding Bond Returns
Understanding how bonds generate returns requires more than simply looking at coupon payments. Investors who study historical market movements need a comprehensive measure that captures the total return potential of fixed-income securities from purchase through final payment. This metric exists as yield to maturity, a calculation that has guided bond investment decisions for decades and remains fundamental to evaluating debt securities today. By examining this concept through historical examples and real market scenarios, we can better appreciate how investors have used this tool to navigate changing interest rate environments and assess opportunities in government and corporate debt markets.
What Yield to Maturity Represents in Bond Markets
Yield to maturity serves as the total return an investor can expect to receive if they purchase a bond at its current market price and hold it until the maturity date. This comprehensive measure incorporates all coupon payments, the difference between purchase price and face value, and the time remaining until the bond reaches maturity.
The calculation assumes that all coupon payments are reinvested at the same rate as the yield to maturity itself. This assumption creates a theoretical framework for comparing bonds with different characteristics, though real-world reinvestment rates may vary based on market conditions.
Historical Context of Fixed-Income Analysis
Bond markets have existed for centuries, but standardized methods for calculating returns evolved gradually. During the early 20th century, investors primarily focused on current yield without considering the time value of money or capital gains. The Merriam-Webster definition of yield to maturity reflects the modern understanding that emerged as financial mathematics advanced.
The Great Depression and subsequent World War II bond drives brought fixed-income securities into mainstream American investment portfolios. Treasury bonds became household investments, creating demand for better analytical tools. By the 1950s and 1960s, yield to maturity calculations had become standard practice among professional bond traders and institutional investors.
Calculating the Total Return on Bond Investments
The yield to maturity calculation requires solving for the discount rate that equates the present value of all future cash flows to the current bond price. This involves a formula that accounts for periodic coupon payments and the final principal repayment.
Essential Components of the Calculation
Every yield to maturity calculation requires five key inputs:
- Current market price of the bond
- Face value or par value of the bond
- Annual coupon payment amount
- Number of years until maturity
- Payment frequency (typically semi-annual for U.S. bonds)
The mathematical relationship between these variables creates a complex equation that typically requires iterative solving or financial calculators. The Wikipedia article on yield to maturity provides the detailed formulation used by analysts and portfolio managers.
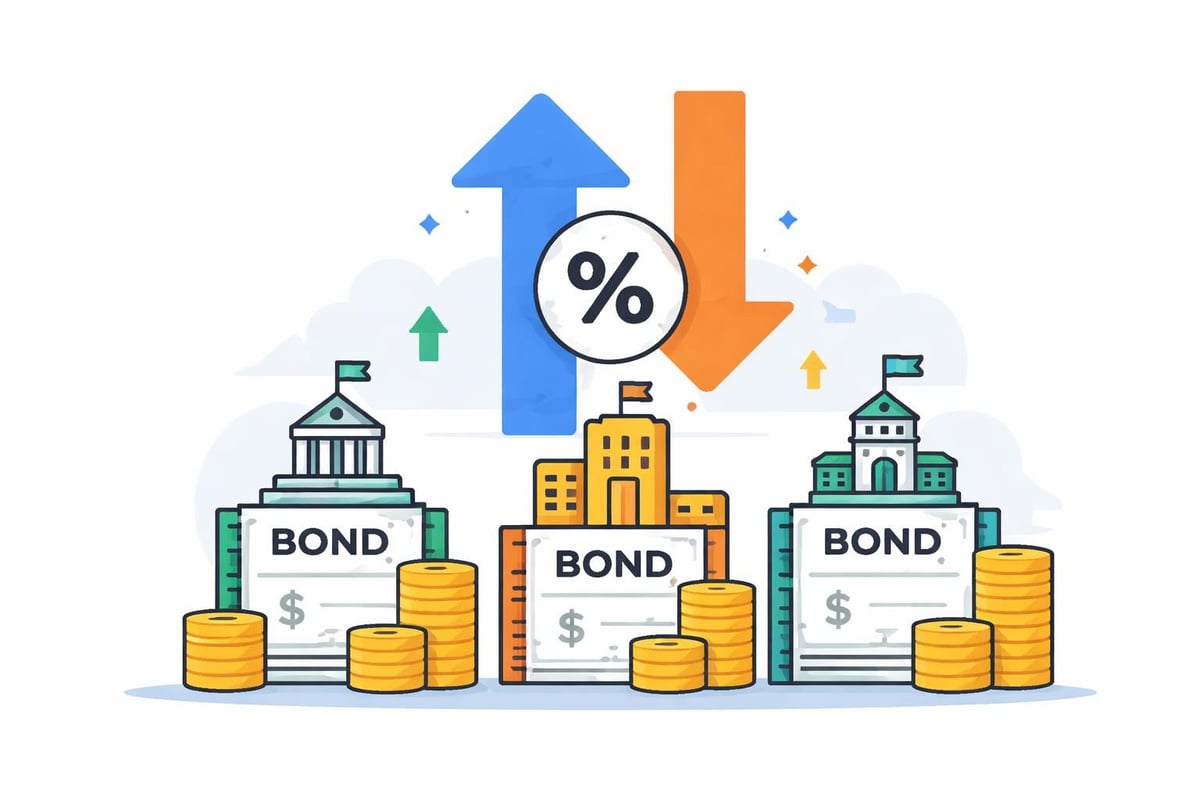
Premium and Discount Bonds
When bonds trade above par value, they sell at a premium, and the yield to maturity falls below the coupon rate. Conversely, discount bonds trading below face value offer yields exceeding their stated coupon rates. This inverse relationship between price and yield has profound implications for bond portfolio management.
| Bond Scenario | Price vs. Par | YTM vs. Coupon | Investor Outlook |
|---|---|---|---|
| Premium Bond | Above $1,000 | YTM < Coupon | Expecting rates to fall further |
| Par Bond | Equal to $1,000 | YTM = Coupon | Neutral interest rate view |
| Discount Bond | Below $1,000 | YTM > Coupon | Anticipating stable or higher rates |
Consider a historical example from 1981, when Federal Reserve Chairman Paul Volcker raised interest rates dramatically to combat inflation. Existing bonds with lower coupon rates traded at steep discounts, creating opportunities for investors willing to lock in high yields to maturity. Those who purchased 30-year Treasury bonds in 1981 locked in double-digit returns that proved extraordinarily valuable as rates declined over subsequent decades.
Interest Rate Movements and Bond Valuations
The relationship between yield to maturity and interest rate changes represents one of the most important dynamics in fixed-income markets. When prevailing interest rates rise, existing bonds become less attractive, causing their prices to fall and yields to maturity to increase. This inverse correlation has shaped countless investment decisions throughout financial history.
Duration and Price Sensitivity
Bond duration measures sensitivity to interest rate changes, with longer-duration securities experiencing greater price volatility. A bond with 20 years until maturity will see more dramatic price swings than a two-year note when rates shift by the same amount. Understanding this concept proved critical during periods like the 1994 bond market correction, when rapid rate increases caught many investors unprepared.
The Financial Edge Training resource on yield to maturity explains how duration and convexity interact with yield calculations to predict price changes. These mathematical relationships form the foundation of modern bond portfolio management strategies.
Reinvestment Risk and Assumptions
The standard yield to maturity calculation assumes all coupon payments can be reinvested at the same rate. This assumption rarely holds perfectly in practice, creating reinvestment risk that investors must consider. During declining rate environments, such as the period following the 2008 financial crisis, investors found it increasingly difficult to reinvest coupons at attractive rates.
Historical reinvestment challenges have emerged during:
- Recession-driven rate cuts (1990-1991, 2001, 2008-2009, 2020)
- Long-term secular declines in yields (1982-2020)
- Central bank quantitative easing programs suppressing returns
- Flight-to-safety episodes driving government bond yields to historic lows
Comparing Yield Metrics Across Bond Types
Multiple yield measurements exist in fixed-income analysis, each serving different analytical purposes. Current yield, yield to call, and yield to worst complement yield to maturity in comprehensive bond evaluation frameworks. Investors examining historical patterns through resources like Historic Financial News benefit from understanding how these metrics interact.
Current Yield Versus Total Return
Current yield simply divides annual coupon payments by market price, ignoring capital gains or losses at maturity. This simpler calculation provides a quick snapshot but misses the complete return picture. During the 1970s inflation crisis, many investors focused excessively on current yield while overlooking that their bonds would mature at face values far below what inflation would erode in purchasing power.
Yield to Call Considerations
Callable bonds give issuers the right to redeem securities before maturity, typically when interest rates fall. For these instruments, yield to call becomes particularly relevant. Corporate bonds issued in the 1990s often included call provisions that companies exercised during the low-rate environment of the 2000s, leaving investors facing reinvestment at lower yields than originally anticipated.
The Nasdaq glossary entry on yield to maturity clarifies distinctions between these various yield measures and their appropriate applications in different market contexts.
| Yield Metric | Best Used For | Key Limitation |
|---|---|---|
| Yield to Maturity | Non-callable bonds held to maturity | Assumes reinvestment at same rate |
| Current Yield | Quick income comparison | Ignores capital gains/losses |
| Yield to Call | Callable bonds in falling rate environment | May not reflect actual holding period |
| Yield to Worst | Conservative analysis of callable bonds | Potentially overly pessimistic |
Historical Case Studies in Bond Markets
Examining specific historical periods reveals how yield to maturity calculations guided investment decisions during pivotal market moments. These examples demonstrate the practical application of this metric across different economic conditions.
The 1980s Rate Reversal
After peaking above 15% in 1981, long-term Treasury yields began a multi-decade decline that created exceptional returns for bondholders. Investors who understood yield to maturity calculations recognized the opportunity to lock in high rates before the trend reversed. A 30-year Treasury purchased in late 1981 at a 14% yield to maturity delivered not only those coupon payments but also substantial capital appreciation as subsequent bonds were issued at progressively lower rates.
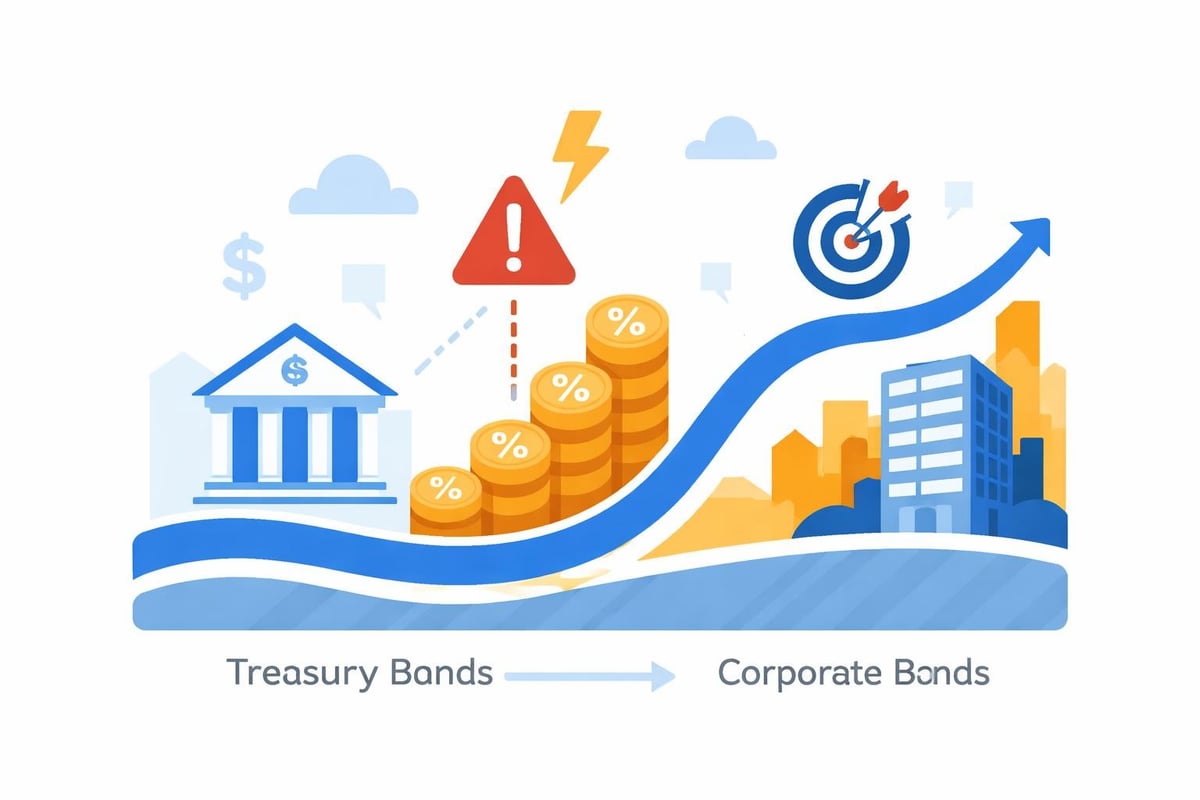
Corporate Bond Spreads During Financial Crises
The spread between corporate bond yields and Treasury yields widens dramatically during periods of economic stress. During the 2008 financial crisis, investment-grade corporate bonds that typically traded 100-200 basis points above Treasuries saw spreads explode to 500-600 basis points. Investors who calculated yield to maturity on these distressed securities and had confidence in corporate survival earned exceptional returns as spreads normalized.
Key crisis periods demonstrating yield spread expansion:
- Latin American debt crisis (1982)
- Savings and Loan crisis (1989-1991)
- Asian financial crisis (1997-1998)
- Dot-com recession (2000-2002)
- Global financial crisis (2008-2009)
- European sovereign debt crisis (2010-2012)
- COVID-19 pandemic shock (March 2020)
The AllBusiness definition from banking and accounting perspectives helps contextualize how different market participants view this metric during stressed conditions.
Practical Applications for Modern Investors
Contemporary bond investors continue to rely on yield to maturity calculations despite evolving market structures and new security types. Understanding this metric remains essential for portfolio construction, risk management, and performance evaluation.
Building Fixed-Income Portfolios
Portfolio managers construct bond ladders using yield to maturity projections to generate predictable income streams while managing reinvestment risk. By staggering maturity dates, investors create opportunities to reinvest proceeds at potentially different rate levels. This strategy proved particularly valuable during the uncertain rate environment of the mid-2010s, when Federal Reserve policy normalization created both risks and opportunities.
Evaluating Convertible Securities
Convertible bonds present unique analytical challenges because they combine fixed-income and equity characteristics. The yield to maturity calculation provides a floor value assuming the bond is never converted, helping investors assess downside protection. Technology companies frequently issued convertible bonds during the late 1990s, and investors who properly evaluated yield to maturity avoided overpaying for conversion features that ultimately proved worthless when equity values collapsed.
International Bond Markets
Global bond markets operate with varying conventions, day-count methods, and payment frequencies that affect yield to maturity calculations. European government bonds often use different accrual conventions than U.S. Treasuries, requiring careful attention to calculation details. The India Infoline explanation of yield to maturity illustrates how this concept applies across different market structures and regulatory frameworks.
Common Mistakes in Yield Analysis
Even experienced investors sometimes misapply yield to maturity concepts or overlook important nuances. Recognizing these pitfalls helps improve analytical accuracy and investment decision-making.
Ignoring Credit Risk
Yield to maturity assumes all promised payments will be received on schedule. This assumption breaks down when issuers face financial distress. High-yield bonds trading at steep discounts may appear to offer attractive yields to maturity, but these calculations become meaningless if the issuer defaults. The wave of corporate defaults during the 2001 recession demonstrated this risk, as many telecommunications and technology companies failed to meet their bond obligations despite seemingly attractive yields.
Overlooking Tax Implications
Municipal bonds typically offer lower yields to maturity than taxable bonds of comparable quality. However, the tax-exempt status of municipal interest makes direct yield comparisons misleading. An investor in a high tax bracket might find a municipal bond with a 3.5% yield to maturity more attractive than a corporate bond yielding 5% once tax effects are considered.
Misunderstanding Callable Bond Dynamics
When interest rates fall significantly below a callable bond's coupon rate, the likelihood of early redemption increases substantially. Calculating yield to maturity based on the final maturity date may overstate expected returns if the issuer exercises its call option. This scenario played out repeatedly during the refinancing waves following rate cuts in 2001, 2008, and 2020.
Tools and Resources for Bond Analysis
Modern technology has made yield to maturity calculations accessible to individual investors through various platforms and resources. Understanding how to leverage these tools enhances analytical capabilities.
Financial calculators and spreadsheet functions automate the iterative solving process required for yield to maturity computations. Excel's YIELD function and dedicated bond calculators on brokerage platforms eliminate manual calculation complexity. The NYU Stern academic resource on bonds and term structure provides theoretical foundations that underpin these practical tools.
Essential resources for bond market participants include:
- Bloomberg Terminal bond analytics
- Federal Reserve Economic Data (FRED) for historical yield curves
- Municipal Securities Rulemaking Board (MSRB) for municipal bond data
- TRACE system for corporate bond transaction reporting
- Treasury Direct for government security information
Exploring finance terms helps build the broader knowledge framework necessary for sophisticated fixed-income analysis. Understanding related concepts like the interest coverage ratio supports credit quality assessment that complements yield evaluation.
The Role of Yield Curves
The relationship between yield to maturity and time to maturity across different bonds creates yield curves that provide crucial economic signals. These curves have predicted recessions, inflation trends, and monetary policy shifts throughout financial history.
Normal, Inverted, and Flat Curves
A normal yield curve slopes upward, with longer-maturity bonds offering higher yields to maturity than shorter-term securities. This reflects compensation for interest rate risk and inflation expectations over extended periods. Inverted yield curves, where short-term rates exceed long-term yields, have preceded every U.S. recession since 1960, making them closely watched indicators.
The yield curve inverted in 1989 before the 1990-1991 recession, in 2000 before the 2001 recession, in 2006 before the 2008 financial crisis, and again in 2019 before the 2020 pandemic recession. Each inversion reflected market expectations that near-term economic weakness would lead to lower rates in the future.
Historical Yield Curve Patterns
Studying historical yield curve shapes through platforms like Historic Financial News reveals recurring patterns across economic cycles. The steepening curve during recovery phases, flattening during mid-cycle expansion, and eventual inversion before recessions creates a recognizable sequence that informed bond market participants have learned to recognize.
Yield to maturity remains an indispensable tool for understanding bond returns, comparing fixed-income opportunities, and analyzing historical market patterns. By examining how this metric evolved and shaped investment decisions across different economic environments, we gain valuable perspective on both successful strategies and costly mistakes. Historic Financial News empowers investors, students, and researchers to explore these patterns through interactive charts and AI-powered analysis, helping you connect past market movements to current investment decisions. Discover how historical context transforms your understanding of financial markets and reveals opportunities others might miss.