
Volatility Index: Understanding Market Fear and Opportunity
The volatility index serves as Wall Street's fear gauge, capturing market sentiment through mathematical precision. Since its introduction by the Chicago Board Options Exchange in 1993, this metric has evolved into an essential tool for understanding investor psychology during calm markets and turbulent crises alike. Whether examining the 2008 financial collapse, the 2020 pandemic shock, or the gradual market adjustments of 2024, the volatility index provides quantifiable insights into collective market anxiety and opportunity. For those studying financial history, this single measure unlocks patterns across decades of market behavior.
Historical Development of the Volatility Index
The volatility index emerged from decades of academic research into options pricing and market behavior. Robert Whaley, a finance professor at Duke University, developed the original calculation methodology in 1993, creating what markets now recognize as the VIX. This innovation transformed abstract market sentiment into concrete numerical values that traders, analysts, and historians could track systematically.
Origins in Options Theory
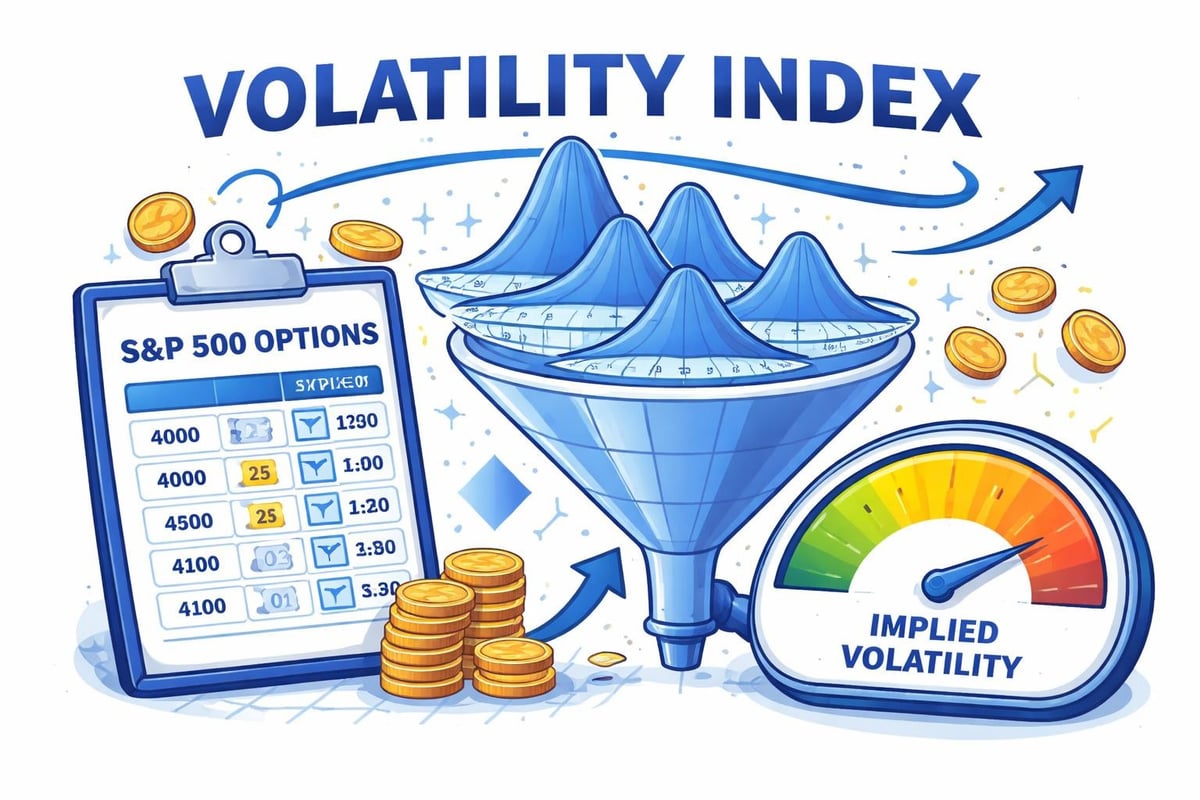
The mathematical foundation rests on the Black-Scholes model and subsequent refinements in options pricing theory. Early versions calculated implied volatility from eight S&P 100 index options, providing a snapshot of expected market movement over the next 30 days. The methodology underwent significant revision in 2003 when the CBOE updated the formula to incorporate a broader range of S&P 500 options, improving accuracy and responsiveness.
Key developments included:
- 1993: Original VIX launch using S&P 100 options
- 2003: Methodology update to S&P 500 options basket
- 2004: Introduction of VIX futures contracts
- 2006: Launch of VIX options for hedging strategies
- 2009-2026: Proliferation of global volatility indices
The evolution parallels broader changes in derivatives markets and reflects growing sophistication in risk management techniques across the financial industry.
Calculation Methodology and Components
Understanding how the volatility index generates its readings requires examining the complex mathematical framework underlying each value. The calculation incorporates hundreds of individual options contracts, weighted according to specific criteria that ensure balanced representation across strike prices. This approach differs fundamentally from simple historical volatility measures that only examine past price movements.
Mathematical Framework
The formula aggregates implied volatility from out-of-the-money puts and calls across multiple strike prices. Each option contributes to the final calculation based on its distance from the current index level and time to expiration. The Sun Life Global Investments resource explains how this methodology captures market expectations rather than realized movements.
| Component | Function | Weighting Factor |
|---|---|---|
| Near-term options | Short-term volatility expectations | Higher for closer expiration |
| Far-term options | Extended volatility outlook | Lower for distant expiration |
| Put options | Downside protection pricing | Strike-dependent |
| Call options | Upside movement pricing | Strike-dependent |
| Strike price spread | Market depth representation | Distance from money |
The result expresses annualized expected volatility as a percentage. A reading of 20 suggests markets anticipate roughly 20% annualized movement in either direction over the next 30 days. This forward-looking nature distinguishes the volatility index from backward-looking statistical measures.
Real-Time Adjustments
Markets calculate and disseminate VIX values every 15 seconds during trading hours. This continuous update cycle captures shifting sentiment as news breaks, economic data releases, and price-to-earnings ratios adjust across individual stocks. The rapid response enables traders to monitor changing conditions and adjust positions accordingly.
Historical Patterns and Notable Spikes
Examining volatility index movements across three decades reveals consistent patterns during market stress. The metric typically trades between 10 and 20 during stable periods, reflecting normal market oscillations and moderate investor uncertainty. Crisis periods produce dramatic spikes that offer valuable lessons for understanding market psychology.
Major Historical Events
1997-1998 Asian Financial Crisis and LTCM Collapse
The volatility index surged above 40 as currency contagion spread from Thailand across Asian markets. The September 1998 collapse of Long-Term Capital Management drove readings above 45, demonstrating how institutional failures amplify market fear. These events established patterns that recurred in subsequent crises.
2008 Financial Crisis
The October 2008 peak of 80.86 remains the highest closing value in VIX history. The comprehensive analysis from the University of Twente documents how this extraordinary spike reflected systemic uncertainty as major financial institutions failed. Daily swings exceeded 20 points as markets struggled to process cascading failures from Lehman Brothers to AIG.
2020 Pandemic Shock
March 2020 produced the third-highest reading when COVID-19 lockdowns triggered unprecedented economic uncertainty. The index hit 82.69 as markets grappled with unknown health outcomes and policy responses. The subsequent rapid decline illustrated how quickly sentiment can shift when central bank interventions provide stability.
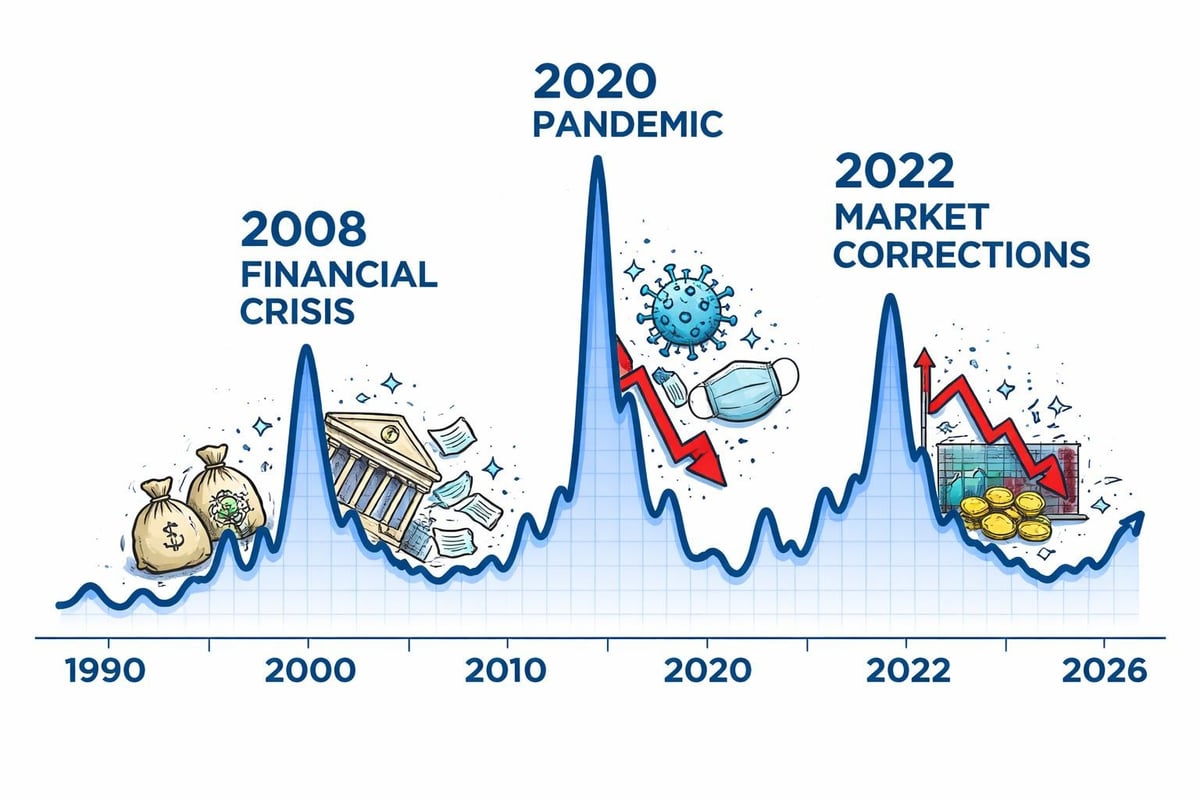
Recent Market Adjustments
The 2022 inflation concerns and interest rate adjustments produced elevated readings in the 25-35 range. Unlike crisis spikes, these sustained higher levels reflected ongoing uncertainty rather than acute panic. The 2024-2026 period saw gradual normalization as markets adjusted to new monetary policy frameworks, with the volatility index settling into a 12-18 range during most quarters.
Interpretation and Trading Applications
Market participants use volatility index readings across multiple strategies and timeframes. The interpretation extends beyond simple fear measurement to encompass hedging decisions, portfolio adjustments, and tactical trading opportunities. Understanding these applications reveals why the metric matters across diverse investor categories.
Reading Level Benchmarks
Professional interpretation follows established thresholds:
- Below 12: Extreme complacency, potential for sharp reversals
- 12-20: Normal market conditions, moderate uncertainty
- 20-30: Elevated concern, active risk management
- 30-40: Significant fear, defensive positioning prevalent
- Above 40: Crisis conditions, extreme uncertainty
These ranges provide context but require adjustment for prevailing market conditions. What constituted extreme fear in 2017 might represent moderate concern in 2026, given structural changes in market composition and trading technologies.
Strategic Applications
Long-term investors monitor the volatility index for portfolio rebalancing signals. Extreme readings often coincide with attractive entry points for growth stocks and other risk assets. As Vanguard's research notes, volatility presents opportunities for disciplined investors rather than merely representing risk.
Practical trading approaches include:
- Using VIX spikes to identify oversold conditions in equity markets
- Implementing hedging strategies when readings remain persistently low
- Adjusting position sizing based on current volatility levels
- Timing entry points for contrarian positions during extreme readings
- Monitoring term structure relationships for additional signals
The derivatives markets enable direct volatility trading through VIX futures and options. These instruments allow sophisticated participants to express views on future volatility independent of directional equity bets.
Global Volatility Indices and Comparative Analysis
While the VIX dominates discussion, numerous regional volatility indices track other major markets. These parallel measures enable comparative analysis and reveal how uncertainty manifests differently across economic regions. The relationships between indices provide additional insights into global capital flows and risk sentiment.
Regional Variations
| Index | Market | Launch Year | Average Level (2020-2026) |
|---|---|---|---|
| VIX | S&P 500 | 1993 | 17.3 |
| VDAX | DAX (Germany) | 1994 | 19.1 |
| VXN | Nasdaq 100 | 2001 | 21.4 |
| VSTOXX | Euro Stoxx 50 | 2005 | 20.8 |
| VHSI | Hang Seng | 2011 | 22.6 |
Technology-heavy indices like the VXN consistently show higher volatility readings, reflecting the sector's inherent uncertainty and growth orientation. Emerging market volatility indices typically trade at premiums to developed market counterparts, compensating for additional political and economic risks.
Correlation Patterns
Historical analysis reveals strong correlations between major volatility indices during crisis periods but divergence during normal conditions. The 2008 financial crisis produced simultaneous spikes across all regions as credit markets froze globally. Conversely, the 2026 European banking adjustments primarily elevated VDAX and VSTOXX while VIX remained relatively subdued.
These patterns help historians identify truly global shocks versus regional disturbances. The Historic Financial News platform enables users to visualize these relationships across different time periods, revealing how contagion spreads through interconnected markets.
Advanced Research and Methodology Developments
Academic research continues refining volatility measurement and forecasting techniques. The past decade has seen particular interest in machine learning applications and alternative calculation methodologies that might improve upon traditional approaches. These developments could reshape how future generations interpret market uncertainty.
Machine Learning Applications
Recent research on neural networks and VIX analysis demonstrates promising results in predicting short-term volatility movements. These models incorporate sentiment analysis, trading volume patterns, and cross-market relationships to generate forecasts beyond what traditional statistical methods achieve. While still evolving, such approaches may eventually supplement or enhance current calculation frameworks.
Alternative Measurement Approaches
Researchers have proposed novel volatility estimators based on cross-sectional entropy and other information-theoretic concepts. These methods attempt to capture market uncertainty through different mathematical lenses, potentially revealing aspects that implied volatility calculations miss. The intrinsic entropy model offers one such alternative framework with distinct theoretical advantages.
Emerging research directions include:
- High-frequency data integration for real-time volatility assessment
- Blockchain-based transparency in derivatives markets underlying calculations
- Behavioral finance integration to better model investor psychology
- Climate risk incorporation into forward-looking uncertainty measures
- Cross-asset volatility relationships beyond traditional equity focus

Volatility Index Limitations and Misconceptions
Despite widespread usage, the volatility index carries inherent limitations that users must understand. Misconceptions about what the metric measures and predicts can lead to flawed investment decisions and misinterpretation of market conditions. Critical analysis reveals both the power and boundaries of volatility-based insights.
Common Misunderstandings
Many observers incorrectly view the volatility index as predicting market direction rather than measuring expected magnitude of movement. A rising VIX indicates increasing uncertainty but provides no information about whether markets will move up or down. This directional neutrality often confuses newcomers who expect fear indices to correlate perfectly with declining markets.
The 30-day forward-looking window creates another common confusion point. The metric doesn't forecast what will happen in exactly one month but rather aggregates market expectations across that timeframe. Actual realized volatility frequently differs from implied volatility, sometimes dramatically.
Structural Constraints
The calculation methodology depends entirely on options market pricing, which introduces several constraints:
- Liquidity requirements: Less liquid options periods may produce unreliable readings
- Market maker influence: Large institutions can temporarily affect VIX through strategic options positions
- Calculation frequency: 15-second updates may not capture extremely rapid sentiment shifts
- Strike price coverage: Extreme events may exceed the range of actively traded options
- Time decay effects: Options mechanics introduce biases unrelated to actual uncertainty
Understanding these limitations prevents over-reliance on any single metric. Comprehensive market analysis requires incorporating multiple indicators, fundamental research, and contextual awareness that extends beyond quantitative measures.
Integration with Broader Market Analysis
The volatility index delivers maximum value when integrated into comprehensive analytical frameworks rather than used in isolation. Historical market analysis particularly benefits from combining volatility data with price movements, economic indicators, and fundamental metrics to construct complete narratives of market episodes.
Multi-Indicator Frameworks
Professional analysts typically examine volatility alongside several complementary measures:
- Price momentum indicators showing market direction and strength
- Operating margins revealing corporate profitability trends
- Debt-to-equity ratios indicating financial leverage across sectors
- Interest rate spreads capturing credit market conditions
- Volatility term structure showing expectations across different timeframes
This holistic approach prevents the tunnel vision that results from focusing exclusively on any single metric. The 2008 crisis demonstrated how rising credit spreads and deteriorating fundamentals preceded VIX spikes, offering early warning signals to attentive observers.
Historical Case Study Integration
Examining specific market episodes through multiple lenses reveals patterns invisible through volatility data alone. The 1987 crash, for instance, showed relatively modest VIX elevation by modern standards because the metric tracked a smaller options universe at that time. Proper historical analysis accounts for these methodological changes across decades.
Students and researchers exploring past market events benefit from platforms that integrate volatility data with contemporary news coverage, policy decisions, and corporate actions. This contextual richness transforms raw numbers into meaningful narratives about how uncertainty manifested during particular periods.
Term Structure and Derivative Relationships
The relationship between different volatility index expirations provides additional analytical dimensions beyond the headline VIX number. The high-frequency causality research on VIX derivatives reveals complex interactions that sophisticated traders monitor for tactical opportunities and risk management signals.
Contango and Backwardation
VIX futures typically trade in contango, with longer-dated contracts priced above near-term ones. This upward-sloping term structure reflects carrying costs and the tendency for volatility to mean-revert over time. During crisis periods, the structure inverts into backwardation as near-term uncertainty exceeds long-term expectations.
| Market Condition | Near-term VIX | 3-Month VIX | 6-Month VIX | Implication |
|---|---|---|---|---|
| Normal contango | 15 | 17 | 18.5 | Stable expectations |
| Steep contango | 12 | 16 | 19 | Very low current fear |
| Backwardation | 35 | 28 | 24 | Acute near-term crisis |
| Flat structure | 20 | 20.5 | 21 | Transition period |
These relationships matter because volatility-based investment products must constantly roll futures positions, generating returns or losses independent of VIX levels. Historical periods of persistent contango or backwardation created distinct outcomes for different trading strategies.
Options on Volatility
VIX options enable nuanced expressions of volatility views beyond simple directional bets. Call options profit from rising uncertainty, while puts benefit from declining fear. The options themselves display unique characteristics because the underlying VIX cannot be directly owned or delivered.
Understanding these derivative layers becomes essential when analyzing modern market structure. The 2018 volatility products crisis demonstrated how feedback loops between VIX levels, futures, options, and related ETPs can amplify market movements beyond levels justified by fundamental conditions.
Educational Resources and Continued Learning
Mastering volatility analysis requires ongoing study as markets evolve and new research emerges. Multiple resources serve different learning styles and experience levels, from introductory overviews to advanced academic research. Building comprehensive knowledge involves progressing through increasingly sophisticated material over time.
Academic and Professional Resources
University research programs continue producing valuable insights into volatility measurement and market behavior. The previously mentioned comprehensive University of Twente analysis provides thorough examination suitable for serious students of financial markets. Academic papers, while sometimes technically demanding, offer depth unavailable in popular financial media.
Professional certifications incorporating options and volatility analysis include the CFA program, CMT designation, and specialized derivatives certifications. These structured learning paths ensure comprehensive coverage of theoretical foundations and practical applications.
Historical Data Access
Analyzing past volatility patterns requires access to quality historical data spanning multiple market cycles. Many platforms provide recent VIX data freely, but comprehensive archives extending back to the 1990s often require professional subscriptions or academic access. The ability to examine how volatility behaved during specific historical episodes transforms theoretical knowledge into practical pattern recognition.
Interactive charting tools enable users to overlay volatility data with price movements, economic releases, and news events. This visual integration helps develop intuition about relationships between market uncertainty and other variables. Students particularly benefit from seeing how volatility responded to events they've studied in financial history courses.
Understanding the volatility index provides essential context for interpreting market behavior across different historical periods, revealing how investor sentiment shifts during calm markets and tumultuous crises. The patterns embedded in volatility data help identify recurring themes in market psychology and potential opportunities during periods of extreme fear or complacency. Historic Financial News empowers investors, students, and researchers to explore these patterns through interactive charts and AI-powered analysis that connects volatility movements with the broader stories behind market events. By examining historical volatility alongside comprehensive market context, users can develop deeper insights into how markets have evolved and what lessons past episodes offer for understanding today's financial landscape.