
Total Return Guide: Understanding Investment Growth in 2026
Imagine unlocking the true growth of your investments, not just by watching prices move, but by capturing every dollar your portfolio generates. Many investors overlook the real drivers of wealth because they focus only on what’s visible at a glance. This guide will demystify total return, helping you see the complete story behind your investment results. You will learn how total return combines income and growth, why it matters for smarter decisions in 2026, and how you can use it to optimize your financial strategy. By the end, you will have the clarity and confidence to measure your investments for maximum impact.
What Is Total Return?
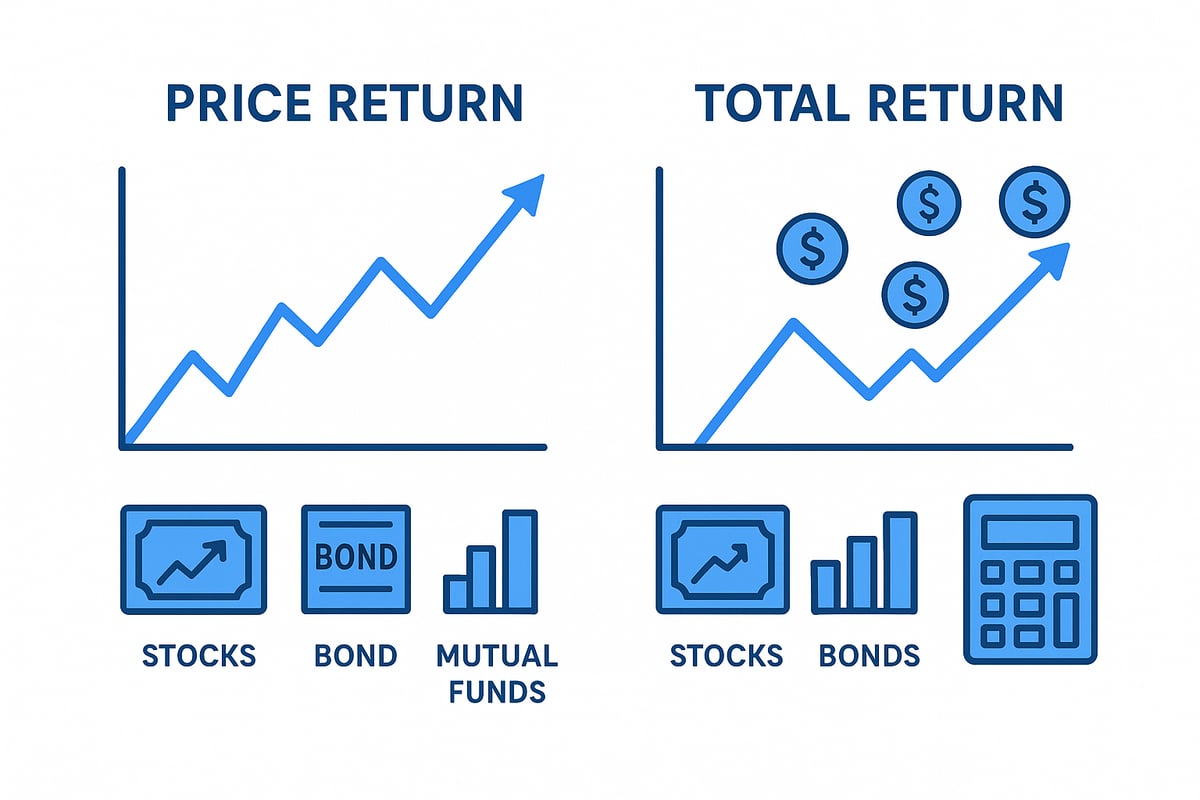
Understanding total return is essential for anyone seeking to measure investment performance accurately. Unlike just tracking price changes, total return lets investors see the complete picture by factoring in every source of growth. This approach shows not only how much an asset's price rises but also every dollar it pays out along the way.
The Core Components of Total Return
Total return is the most comprehensive measure of how your investments are truly growing. It captures all sources of profit, including capital appreciation, dividends, interest, and any other distributions you receive. While price return only reflects the change in an asset's price, total return sums up both price gains and all income generated.
Consider two stocks: Stock A grows from $100 to $120 in a year but pays no dividend. Stock B grows from $100 to $110, yet pays $6 in dividends. Stock A's price return is 20 percent, while Stock B's price return is 10 percent. However, Stock B's total return is 16 percent, making it a stronger performer when income is included.
| Stock | Starting Price | Ending Price | Dividends | Price Return | Total Return |
|---|---|---|---|---|---|
| Stock A | $100 | $120 | $0 | 20% | 20% |
| Stock B | $100 | $110 | $6 | 10% | 16% |
Mutual funds and ETFs routinely report total return, showing investors the combined effect of price gains and distributions. As the Motley Fool notes, total return includes both capital gains and dividends, offering a holistic perspective. By focusing on total return, investors avoid missing out on the full impact of their investment choices.
For more clarity on these and other financial terms, visit the Financial terms glossary.
Total Return vs. Distribution Rate and Yield
It's easy to confuse total return with yield or distribution rate, but these are distinct concepts. Yield refers to the income generated by an investment, expressed as a percentage of its price. Distribution rate is simply the current payout as a percentage of the fund's net asset value. Neither tells you how much your investment has grown overall.
Imagine a fund with a high distribution rate but flat or even negative price growth. The income may look appealing, but if the asset's price is falling, your total return could be low or even negative. Reinvesting dividends can further boost total return, thanks to the power of compounding over time.
Many investors focus only on yield, missing the impact of dividends and price changes on their total return, as noted by the Motley Fool. This misconception can lead to poor decisions, such as chasing high-yield assets that underperform when all factors are considered.
When comparing investments, always look beyond yield or distribution rates. Only total return provides the complete picture, revealing the true growth of your portfolio and helping you make informed choices.
Why Total Return Matters for Investors in 2026
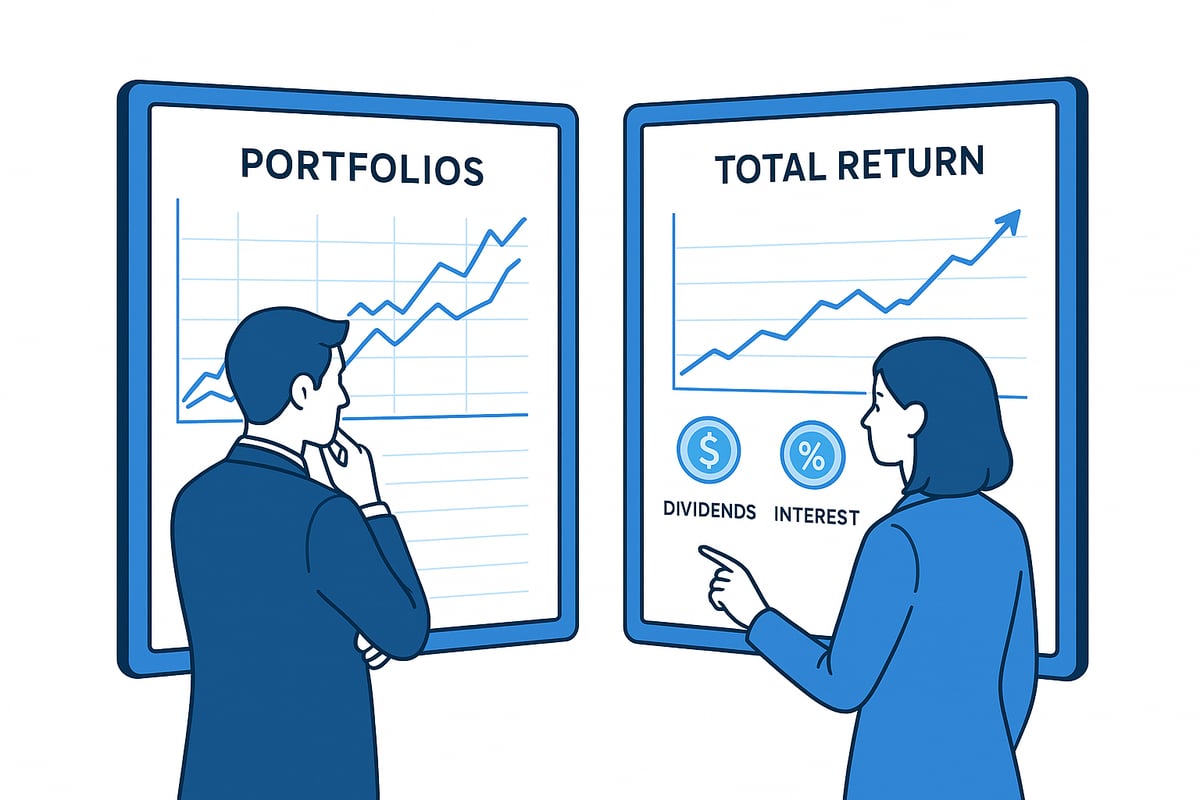
Understanding total return is essential for investors who want a clear, complete picture of how their money grows. While many focus only on price changes, total return captures both the income and appreciation that drive wealth. This comprehensive view is more important than ever as we approach 2026, a year expected to bring new opportunities and challenges for investors.
The Big Picture: Comprehensive Performance Assessment
Total return gives investors the full story by combining both income from dividends or interest and price appreciation. This holistic approach allows you to see not only how much your investment's price has increased, but also how much cash it has generated along the way.
For example, consider two investors: one focused on growth stocks that rarely pay dividends and another who prefers dividend-paying blue chips. If you compare these investments using only price changes, you miss a significant portion of the gains. Total return ensures you account for every dollar earned, making comparisons across diverse assets fair and accurate.
Here’s a simple table comparing S&P 500 price return and total return over a decade:
| Year | S&P 500 Price Return | S&P 500 Total Return |
|---|---|---|
| 2014-2024 | 150% | 220% |
This difference comes from reinvested dividends, which can significantly boost your outcome over time.
Total return matters for all investor types. Growth investors get a better sense of long-term compounding, while income-focused investors see the true impact of regular payments. As the Motley Fool notes, total return allows you to see the big picture, not just share price.
When planning for retirement or building wealth, relying solely on price appreciation or yield can lead to costly mistakes. Total return helps avoid these traps by revealing both hidden value and potential risks across stocks, bonds, and funds.
By focusing on total return, you gain a more accurate perspective for comparing different asset classes. This insight is crucial when balancing a portfolio or making strategic decisions that will shape your financial future.
Total Return in the Context of 2026 Market Trends
The investment landscape in 2026 will be shaped by several key factors, including changing interest rates, inflation, and market volatility. Each of these influences total return in unique ways, making it vital to evaluate investments using a comprehensive approach.
Rising or fluctuating interest rates can affect both the income and price components of total return. For example, bond funds may see their yields rise, but prices could fall, impacting overall results. Inflation is another critical factor. Measuring your total return after adjusting for inflation gives you a clearer sense of real growth, not just nominal gains.
Recent years have shown that dividend trends can support total return, especially during periods of uncertainty. When markets are volatile, the income portion of total return can help cushion losses and provide stability. This is especially relevant for investors who rely on steady cash flow.
Looking ahead, leading financial institutions like Vanguard provide forecasts to help set expectations for 2026. According to Vanguard's 2026 Return Forecasts, understanding the components of total return is crucial for navigating anticipated market conditions.
Total return is not just a metric for past performance, but a tool for adapting to evolving markets. By focusing on total return, investors can make informed decisions that account for both growth and income, positioning their portfolios for long-term success.
How to Calculate Total Return: Step-by-Step Guide
Understanding how to calculate total return is essential for accurately measuring your investment performance. A step-by-step approach ensures you capture every component that contributes to your portfolio’s growth. Let’s break down the process so you can confidently evaluate any investment’s total return.

Step 1: Identify All Sources of Return
Start by listing every way your investment generates value. For stocks, this means both price appreciation and dividends. Bonds and funds add interest payments and distributions to the mix.
Key sources include:
- Price appreciation: increase in market value
- Dividends: periodic cash payouts from stocks or funds
- Interest: income from bond holdings or cash equivalents
- Distributions: special or recurring payouts from funds
To fully capture total return, you must tally all these components. For example, if you own a stock purchased at $100, now worth $120, and you received $5 in dividends, both the price gain and dividend count toward your total return.
Understanding the income component is especially important for bond and fund investors. For a deeper look at how interest income factors in, see what is net interest margin.
Step 2: Calculate Dollar and Percentage Total Return
Once you have all sources, use the total return formula to measure growth. The basic calculation is:
Total Return (%) = (Ending Value + Dividends/Distributions – Beginning Value) / Beginning Value x 100%
Let’s see it in action:
- Beginning Value: $100
- Ending Value: $120
- Dividends: $5
Calculation:
- Dollar total return: $120 + $5 – $100 = $25
- Percentage total return: $25 / $100 = 25%
This approach works for a single period. For investments held over multiple years, clarify if you want the cumulative or annualized total return. Cumulative shows overall gain, while annualized smooths it over time.
Step 3: Adjust for Reinvested Dividends
Reinvesting dividends can significantly boost total return due to compounding. Instead of taking payouts as cash, you buy more shares, which generate even more dividends over time.
Consider two scenarios:
- Without reinvestment: You pocket $5 in dividends, so your total return is based on price gain plus cash received.
- With reinvestment: Each dividend buys more shares, so future dividends and price gains are calculated on a growing base.
Studies show that reinvested dividends can substantially increase your total return, especially over long periods. Always factor in reinvestment to see the true compounding effect.
Step 4: Consider Fees, Taxes, and Inflation
Gross total return does not account for costs that can erode your gains. Always adjust for the following:
- Management fees: Fund expenses reduce your net return.
- Taxes: Dividends and capital gains may be taxable, lowering your real earnings.
- Inflation: Rising prices decrease the purchasing power of your returns.
For example, if your nominal total return is 8 percent, but fees and inflation total 3 percent, your real total return is just 5 percent. Net total return gives you the most accurate picture for comparison and planning.
Step 5: Use Tools and Resources
Several resources can simplify the process of tracking total return:
- Online calculators: Input your investment data for instant results.
- Brokerage statements: Most major brokers report total return for your holdings.
- Fund fact sheets: Mutual funds and ETFs often display historical total return.
- Timeframe comparison: Ensure you compare investments over the same period for accuracy.
Using these tools helps you stay consistent and confident in your total return analysis. Consistent tracking over time leads to smarter investment decisions.
Real-World Examples of Total Return in Action
Understanding total return in practice can transform the way you evaluate investments. Many investors focus on price increases alone, but this approach misses significant income that can drive real growth. Exploring real-world examples helps illustrate why total return is the key metric for meaningful portfolio comparisons.
Comparing Stocks: Price Growth vs. Dividends
Consider two stocks. Stock A offers rapid price appreciation but pays minimal dividends. Stock B grows more slowly but delivers high dividend payouts. Which investment delivers superior total return over time?
| Stock | Price Growth (%) | Dividend Yield (%) | Total Return (%) |
|---|---|---|---|
| A | 10 | 1 | 11 |
| B | 4 | 6 | 10 |
In this scenario, Stock A’s total return edges out Stock B by combining strong capital gains with a modest dividend. However, if Stock B’s price growth improves slightly or its dividend increases, it could surpass Stock A. This demonstrates that total return, not just price changes, determines the real winner.
Many investors are surprised to learn that a stock with a 5 percent dividend yield and 5 percent price growth actually delivers a 10 percent total return, as highlighted by Motley Fool. By focusing on total return, you can see the true impact of reinvested dividends, which can compound over time and significantly boost your overall gains.
Mutual Funds and S&P 500: Revealing Hidden Value
Let’s look at mutual funds. Suppose Fund X and Fund Y both have a 3 percent yield, but Fund X’s share price remains flat while Fund Y appreciates by 4 percent. Their total returns would be 3 percent and 7 percent, respectively. This example shows why comparing total return is essential, even when yields appear similar.
A classic case is the S&P 500. Over the past decade, the index’s price return lagged behind its total return, which includes dividends reinvested. Investors who only tracked price changes missed out on a substantial portion of growth. According to J.P. Morgan's 2026 Market Assumptions, understanding total return is crucial for setting realistic expectations and making informed decisions as market conditions evolve.
Focusing solely on price can hide risks or opportunities. For example, a portfolio heavy in stocks with little income may underperform over time, especially if market volatility increases. By using total return as your benchmark, you get a clearer sense of your investments’ true performance and can better identify assets that align with your financial goals.
Applying Total Return to Investment Strategy
Effectively applying total return to your investment strategy is essential for maximizing both growth and income. By focusing on total return, you gain a comprehensive perspective on portfolio performance, allowing you to make decisions that align with your financial objectives.
Using Total Return for Portfolio Optimization
When optimizing a portfolio, total return serves as a powerful tool for evaluating and selecting assets. Instead of looking solely at price changes or yields, total return incorporates all elements of growth, including capital appreciation, dividends, and distributions. This broader view allows you to compare investments on equal footing.
Balancing growth and income is a core part of asset allocation. For example, an investor may hold both high-growth stocks and income-generating bonds. By calculating total return for each asset, you can determine which combination delivers the best performance for your risk profile and goals.
Suppose you own two mutual funds: Fund A with steady price growth and low dividends, and Fund B with modest growth but high distributions. Evaluating their total return over the same period reveals which fund truly adds more value to your portfolio.
Regularly reviewing total return helps identify when to rebalance. If one asset class is underperforming in total return, you might shift funds to higher-performing options. This approach ensures your portfolio evolves with market conditions and personal needs.
Comparing total return also enhances decision-making when choosing between ETFs, mutual funds, or individual stocks. Many investors rely on metrics like the price-to-earnings ratio, but integrating understanding price-to-earnings ratio with total return analysis offers a more complete picture.
Ultimately, prioritizing total return aligns your strategy with long-term goals such as retirement or education funding. It supports data-driven decisions and helps you capture both income and appreciation for sustained growth.
Common Mistakes and How to Avoid Them
Many investors fall into traps when using total return. Recognizing these mistakes can protect your strategy and boost outcomes:
- Focusing only on yield or price appreciation, ignoring the full impact of total return.
- Overlooking fees, taxes, or inflation, which can reduce actual returns.
- Comparing investments over inconsistent timeframes, leading to misleading conclusions.
- Misinterpreting high distribution rates as indicators of high total return.
For example, a fund with a high yield might seem attractive, but if its price declines, overall total return could lag behind other options. Always check both components.
To avoid these pitfalls:
- Always calculate and compare total return using the same period for each investment.
- Adjust for management fees, taxes, and inflation to understand real performance.
- Do not judge an asset solely by its yield or distribution rate.
- Use total return as your primary metric for evaluating and rebalancing your portfolio.
Applying these best practices ensures your investment decisions are guided by accurate, holistic performance data. This disciplined approach can help you achieve your long-term financial objectives with greater confidence.
Advanced Insights: Total Return and Historical Market Patterns
Understanding how total return evolves through market cycles is crucial for investors looking to build resilience and maximize growth. By studying the patterns and lessons embedded in decades of investment history, you gain a more realistic perspective on what drives long-term wealth. Context is everything—especially when preparing for the unique challenges and opportunities of 2026.
Learning from Market History to Inform Future Growth
Total return is shaped not only by the assets you choose but also by the market environment. Looking back, periods of strong economic growth often delivered robust total return, while recessions or crises tested the resilience of income and appreciation.
For example, during the bull market from 2009 to 2019, the S&P 500’s total return soared, combining price gains with reinvested dividends. Yet, in the early 2000s, the dot-com bust and subsequent recovery highlighted how dividend income cushioned portfolios when prices stagnated.
Here’s a quick comparison of historical periods:
| Period | Price Return | Dividend Yield | Total Return |
|---|---|---|---|
| 2000–2002 Bust | -38% | 1.5% | -36% |
| 2003–2007 Boom | +82% | 1.8% | +93% |
| 2008 Crisis | -37% | 2.2% | -35% |
| 2009–2019 Bull | +190% | 2.0% | +250% |
These numbers underscore how total return paints a fuller picture than price alone. Investors who ignored dividends or failed to reinvest often missed out on compounding effects.
Contextualizing total return within historical events helps you avoid repeating past mistakes. For instance, overestimating future gains after a long bull run or underestimating recovery potential after severe downturns can skew your strategy. By recognizing these cycles, you can set more informed expectations for the years ahead.
Looking forward, economic projections like RBC's 2026 U.S. Economic Outlook can help investors align historical lessons with current market realities. This approach grounds your total return strategy in both data and perspective.
How to Explore Total Return Trends with Historical Data Tools
Digging into total return trends requires reliable data and the right analytical tools. Interactive charts, sector breakdowns, and news archives allow you to pinpoint how specific events influenced investment outcomes.
For example, by comparing sector total return across decades, you can spot which industries outperformed in different environments. This insight is invaluable for constructing a diversified portfolio that’s built to weather future market shifts.
Students, journalists, and long-term investors all benefit from tools that reveal not only the numbers but also the stories behind market moves. Understanding these patterns elevates your ability to make informed, forward-looking decisions.
Explore Total Return History with Historic Financial News
Historic Financial News offers a powerful platform for analyzing total return through time. With interactive charts, you can zoom into pivotal events and see how they shaped investment performance.

AI-powered summaries and original news coverage provide the context needed to interpret total return in relation to real-world events. Whether you’re planning for 2026 or researching past cycles, this resource empowers you to turn history into actionable insight for your financial strategy.
As you’ve seen, understanding total return gives you a clearer, more complete picture of your investment growth—especially as we head into 2026. If you’re eager to see how markets have moved over time and want tools that help you dig deeper into the stories behind those numbers, you’re in good company. At Historic Financial News, we’re building a platform designed to make market history accessible and actionable, with interactive charts and intelligent insights for investors like you. If you’d like to shape this experience and get early access, Join as a Beta User.