
Return on Equity Guide: Master ROE Analysis in 2025
In 2025, understanding return on equity will be crucial for anyone aiming to stay ahead in today’s competitive markets. This metric offers a clear lens into how efficiently a company uses its capital to generate profits, making it a favorite among top investors and business leaders.
This guide will demystify return on equity, providing you with expert strategies and actionable steps to analyze and leverage this key financial measure. Whether you are an investor or a manager, mastering return on equity can help you make smarter, data-driven decisions.
You will learn everything from the basics of calculation and interpretation to advanced analysis techniques, real-world applications, and common pitfalls. Ready to become an expert? Read on to unlock the full potential of return on equity in your financial strategy.
Understanding Return on Equity: Fundamentals and Importance
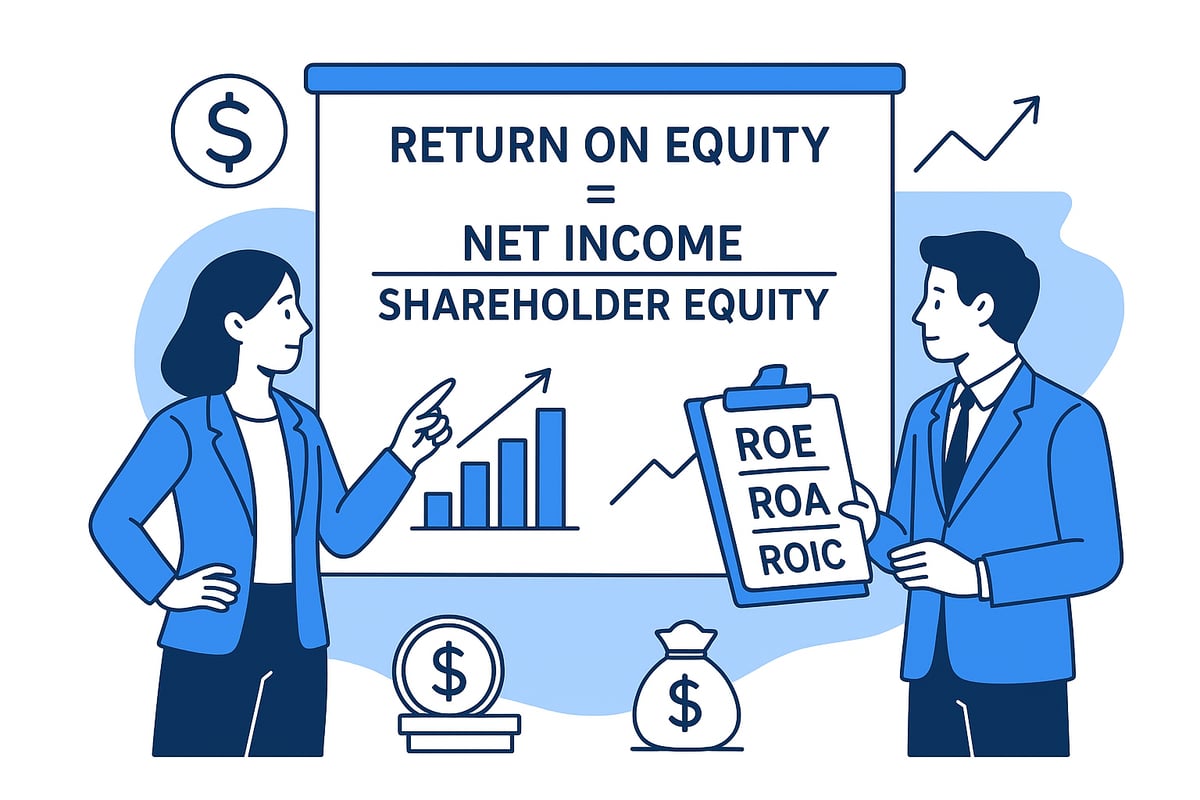
Return on equity is a foundational metric in financial analysis, measuring how effectively a company uses its shareholders' capital to generate profits. This ratio is crucial for investors and business leaders because it highlights the company’s ability to turn equity investment into net earnings. In essence, a higher return on equity signals that the business is maximizing value for its owners.
The core formula for return on equity is simple yet powerful:
Return on Equity = Net Income ÷ Shareholder’s Equity
Net income represents the company’s profit after expenses and taxes, while shareholder’s equity is the total assets minus total liabilities. If you want to explore this component further, see Understanding Shareholder Equity for a detailed breakdown. Each part of the formula plays a vital role in accurately assessing a company’s profitability.
Why is return on equity such a critical tool for decision-makers? It allows investors and managers to compare profitability across companies of different sizes and industries. For decades, return on equity has guided strategic decisions, helping highlight which firms are truly efficient in their use of capital. A company with a high return on equity is often seen as managing its resources well, but this figure must always be interpreted in the right context.
To illustrate, consider two companies each reporting $10 million in net income. If Company A has $50 million in equity, its return on equity is 20 percent. Company B, with $100 million in equity, posts a return on equity of 10 percent. Even with identical profits, Company A is using its capital more efficiently. This simple example shows why return on equity stands out among other ratios.
Let’s compare return on equity with similar metrics:
| Ratio | Formula | Focus |
|---|---|---|
| Return on Equity | Net Income ÷ Shareholder Equity | Profitability for owners |
| Return on Assets | Net Income ÷ Total Assets | Overall asset efficiency |
| ROIC | Net Operating Profit ÷ Invested Capital | Capital allocation efficiency |
| ROI | Gain from Investment ÷ Cost of Investment | General investment return |
Return on equity is unique because it zeroes in on the shareholder perspective, unlike return on assets which includes all capital providers or ROIC which focuses on total invested capital. This makes return on equity especially meaningful for stock investors.
It’s important to remember that a high return on equity can sometimes be misleading. For example, excessive debt can artificially inflate the ratio. That’s why context is essential, and comparing return on equity with industry benchmarks is critical. In recent years, the average S&P 500 return on equity has ranged from 15 to 18 percent, providing a useful benchmark for evaluating individual companies.
In summary, return on equity remains a cornerstone metric for assessing profitability and efficiency. When used with context and compared properly, it offers deep insights into how well a company is using its capital to drive growth and shareholder value.
Calculating ROE: Step-by-Step Methods and Best Practices
Accurately calculating return on equity is essential for understanding a company’s profitability and financial efficiency. Whether you’re an investor, analyst, or business leader, mastering this process can reveal powerful insights into how well a company generates returns from its shareholders’ investments.
Step-by-Step: How to Calculate Return on Equity
Start by gathering the right data. You need net income, which is found at the bottom of the income statement, and average shareholder equity, typically shown on the balance sheet. For a refresher on how net income is derived, see Net Income on Income Statement.
Next, adjust net income if necessary. Subtract preferred dividends, as these are not available to common shareholders. Also, exclude any one-time gains or losses to ensure the figure reflects ongoing profitability.
To calculate average equity, add the beginning and ending shareholder equity for the period, then divide by two. This approach smooths out fluctuations and provides a more accurate basis for the return on equity calculation.
With these figures ready, apply the core formula:
ROE = Net Income / Average Shareholder’s Equity
Example: Calculating ROE Using 2024 Financials
Imagine a company with a net income of $10 million in 2024. Its shareholder equity was $60 million at the start of the year and $70 million at the end.
First, calculate average equity:
Average Equity = ($60M + $70M) / 2 = $65M
Then, apply the return on equity formula:
ROE = $10M / $65M = 15.4%
This result indicates the company generated a 15.4% return on equity for the year, which aligns closely with recent S&P 500 averages.
Best Practices for Accurate ROE Analysis
Consistency and transparency are vital when working with return on equity. Always use average equity rather than just year-end figures to avoid distorted results. Double-check for non-recurring items or accounting adjustments that could artificially inflate or deflate net income.
Benchmark your calculated ROE against industry standards and the company’s own historical performance. This context helps identify whether a result is truly strong or simply the product of temporary factors.
Finally, document your calculation methods and any adjustments made. This practice ensures your return on equity analysis remains clear, repeatable, and trustworthy for future comparisons.
Interpreting ROE: Industry Benchmarks, Trends, and What’s “Good” in 2025
Understanding how to interpret return on equity is essential as market dynamics shift in 2025. With investors and analysts seeking clarity in volatile conditions, knowing what qualifies as a strong return on equity helps separate exceptional performers from the pack.
What Is a “Good” Return on Equity in 2025?
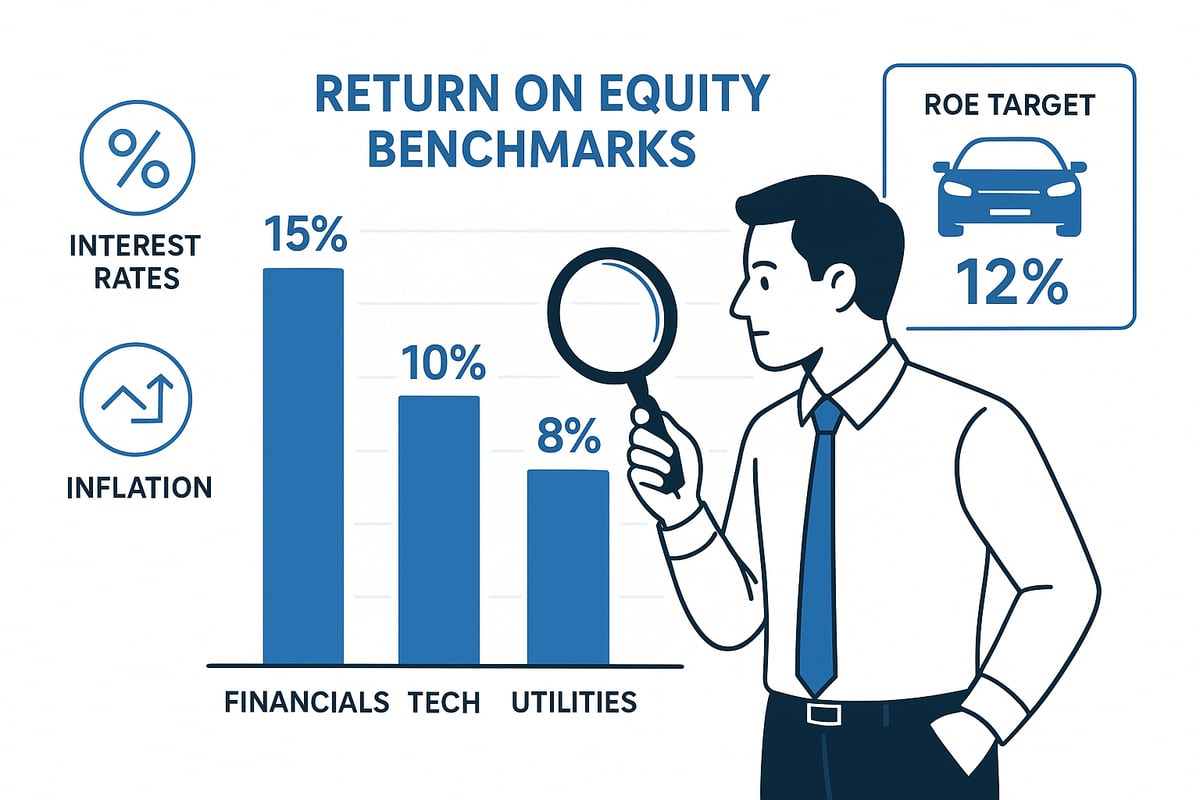
The definition of a “good” return on equity depends heavily on industry context. In 2025, sector benchmarks have evolved due to shifting interest rates and ongoing inflation. For instance, financial institutions typically post higher return on equity figures thanks to leverage, while utilities trend lower due to capital intensity.
Here’s a snapshot of median return on equity by sector:
| Sector | Median ROE (2025) |
|---|---|
| Banks | >12% |
| Retail | 10–15% |
| Utilities | 8–10% |
| Technology | 15–20% |
| Industrials | 10–14% |
These numbers serve as starting points, not strict targets. What matters more is how a company’s return on equity compares to its direct peers and its own historical performance. For example, Toyota has prioritized a steady ROE, with leadership publicly reaffirming efforts to maintain consistent returns year after year. Their approach, as covered in Toyota's consistent ROE target, highlights how global firms use ROE as a guiding metric for sustainable growth.
Trends Shaping ROE Across Industries
Rising interest rates and inflation are reshaping return on equity benchmarks. In banking, higher rates can boost net income and, in turn, ROE. However, for capital-heavy sectors like utilities, increased borrowing costs may compress returns.
The technology sector often reports high return on equity, but this can be driven by intangible assets and rapid growth cycles. It is crucial to distinguish between a high ROE that is sustainable and one fueled by short-term factors or excessive leverage.
High vs. Sustainable ROE: Why Quality Matters
Not all impressive return on equity figures are created equal. A company with a consistently strong, sustainable ROE is more likely to deliver long-term value than one with volatile or artificially inflated numbers. Investors should pair return on equity with complementary ratios, such as profit margin and debt-to-equity, for a more holistic assessment.
Contextualizing ROE: Lifecycle and Capital Structure
A company’s stage in its lifecycle profoundly influences its return on equity. Mature firms may post stable, moderate ROE, while young, fast-growing companies can swing widely. Capital structure also matters—a high return on equity driven by debt may signal risk rather than true efficiency.
Red Flags: When ROE Sends Warning Signals
Be alert to these warning signs when evaluating return on equity in 2025:
- Return on equity far above sector norms, especially if debt levels are high
- Sudden spikes or drops without operational explanation
- Negative equity producing misleadingly high ROE
- ROE disconnected from cash flow or margin trends
In summary, interpreting return on equity in 2025 means looking beyond headline numbers. Sector benchmarks, economic trends, and company-specific factors all shape what’s truly “good.” By understanding these nuances, analysts and investors can use return on equity as a reliable tool for smarter decisions.
Advanced ROE Analysis: The DuPont Framework and Beyond
Understanding the true drivers behind return on equity is essential for investors and business leaders who want to look beyond surface-level financial ratios. The DuPont framework offers a powerful lens to dissect ROE, uncovering whether profitability, asset efficiency, or leverage is powering a company's results. This strategic breakdown helps you identify strengths, spot risks, and make better financial decisions.
The DuPont Formula: Breaking Down Return on Equity
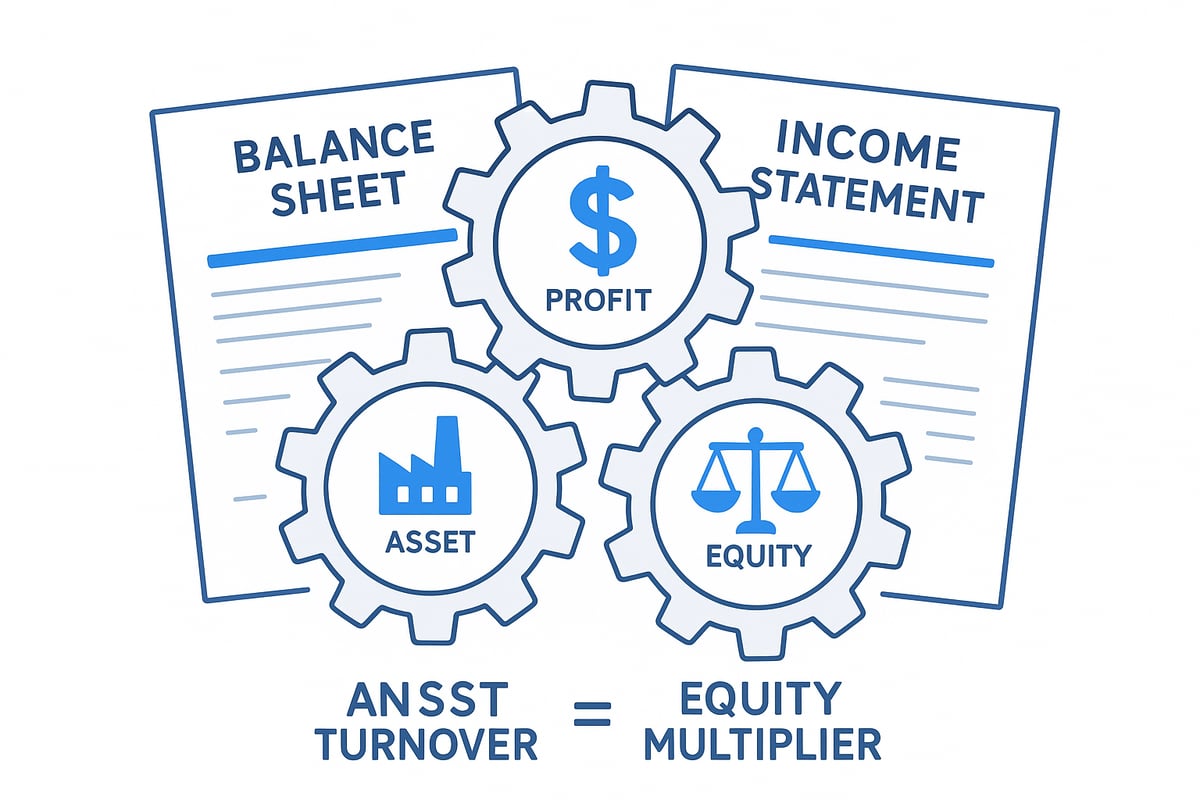
The DuPont formula dissects return on equity into three core components:
- Profit Margin: Measures how much profit a company keeps from each dollar of sales.
- Asset Turnover: Indicates how efficiently a company uses its assets to generate revenue.
- Equity Multiplier: Reflects the degree of financial leverage used.
The DuPont equation is:
Return on Equity = Profit Margin x Asset Turnover x Equity Multiplier
Each factor tells a different story about company performance. By multiplying them together, you see exactly how operational efficiency, asset management, and leverage combine to influence return on equity.
Calculating Each DuPont Component
Let’s walk through the steps to calculate these components:
- Profit Margin = Net Income / Revenue
(For a deeper dive, see Operating Margin and Profitability) - Asset Turnover = Revenue / Average Total Assets
- Equity Multiplier = Average Total Assets / Average Shareholders’ Equity
For example, consider a manufacturing firm with the following 2024 data:
| Component | Value | Formula | Result |
|---|---|---|---|
| Net Income | $2,000,000 | ||
| Revenue | $20,000,000 | ||
| Avg Total Assets | $10,000,000 | ||
| Avg Shareholders’ Equity | $4,000,000 | ||
| Profit Margin | 2,000,000 / 20,000,000 | 10% | |
| Asset Turnover | 20,000,000 / 10,000,000 | 2.0 | |
| Equity Multiplier | 10,000,000 / 4,000,000 | 2.5 | |
| Return on Equity | 10% x 2.0 x 2.5 | 50% |
This example shows how a high return on equity can stem from a mix of margins, efficiency, and leverage.
Interpreting the Drivers of ROE
When analyzing return on equity, it’s crucial to understand which component is driving results.
- If profit margin is strong, the company is controlling costs well.
- High asset turnover suggests efficient use of resources.
- A high equity multiplier points to significant use of debt financing.
Comparing these elements across sectors reveals typical patterns. For example:
| Sector | Avg Profit Margin | Avg Asset Turnover | Avg Equity Multiplier |
|---|---|---|---|
| Tech | 18% | 0.8 | 2.0 |
| Manufacturing | 10% | 1.5 | 2.3 |
| Utilities | 12% | 0.5 | 3.5 |
A tech company might show high return on equity due to margins, while a utility’s ROE could be leverage-driven.
Beyond DuPont: Advanced Adjustments
Modern return on equity analysis often goes further than the classic DuPont breakdown. Analysts may adjust for:
- Tax effects, which can distort after-tax profit margins.
- Non-operating items, such as one-time gains or losses.
- Sector-specific factors, like intangible assets in technology or regulatory capital in banking.
These adjustments provide a more accurate picture of sustainable return on equity. Understanding these nuances helps you avoid being misled by temporary spikes or accounting quirks.
DuPont Analysis in Strategic Management
The DuPont framework is more than a calculation tool. It empowers management to pinpoint operational weaknesses and optimize capital structure. Investors use it to distinguish between companies generating high return on equity from strong operations versus those relying on leverage. Ultimately, mastering DuPont analysis gives you a sharper edge in evaluating financial health and guiding smarter investment or business decisions.
Common Pitfalls and Misinterpretations of ROE
Understanding the return on equity metric is essential, but misinterpretations can easily lead to costly mistakes. Even experienced analysts can fall into traps if they overlook the nuances behind a company's ROE figure. Let's explore the most common pitfalls and how to avoid them.
Pitfall 1: Ignoring the Impact of Leverage on ROE
One of the most frequent missteps is failing to consider how leverage can artificially inflate return on equity. Companies can boost ROE by taking on more debt, which reduces equity and raises the ratio, even if core profitability remains unchanged. If you only look at the headline ROE, you might miss underlying risks. For a deeper understanding, reviewing the Debt-to-Equity Ratio explained can help reveal how leverage affects ROE and overall financial health.
Pitfall 2: Overlooking Accounting Changes and Non-Recurring Items
Another common pitfall is ignoring the effect of one-time events, such as asset write-downs or restatements. These can distort net income, making the return on equity appear higher or lower than sustainable levels. Similarly, failing to adjust for non-recurring gains or losses—like the sale of a business segment—can mislead investors about ongoing profitability. Always review footnotes and management discussion for clues about any unusual items that might skew the numbers.
Pitfall 3: Comparing ROE Across Unrelated Industries
Return on equity benchmarks vary widely by sector. Comparing the ROE of a tech firm with that of a utility or a bank ignores differences in business models, asset intensity, and capital structures. For example, a utility’s typical ROE is much lower than a financial institution’s due to regulatory and capital requirements. Instead, always compare companies within the same industry and consider the typical ROE range for that sector.
Pitfall 4: Misleading Signals from Negative Equity or Buybacks
Occasionally, companies with negative equity—often from sustained losses or aggressive share buybacks—report extremely high or even nonsensical ROE. This scenario doesn't indicate superior performance, but rather a distorted denominator in the calculation. Recent years have seen an uptick in ROE distortions due to buybacks, particularly among large-cap firms.
| Pitfall | Why It’s Misleading | How to Spot It |
|---|---|---|
| High leverage | Boosts ROE, adds financial risk | Check debt-to-equity ratio |
| Non-recurring items | Skews net income, inflates ROE | Review financial footnotes |
| Industry comparisons | Ignores sector differences | Use industry benchmarks |
| Negative equity | Distorts calculation, not real performance | Analyze equity trends |
Best Practices to Avoid ROE Misinterpretations
To use return on equity effectively, combine quantitative analysis with qualitative context. Always adjust for one-time items, monitor changes in leverage, and benchmark against suitable peers. Be skeptical of extreme ROE values and dig deeper when numbers look too good to be true. By following these steps, you will gain a more accurate and actionable perspective on a company's true financial performance.
The Future of ROE Analysis: Trends and Innovations for 2025
The landscape of return on equity analysis is undergoing significant transformation in 2025. As financial markets become more complex and data-driven, both investors and corporate leaders are rethinking how they interpret and act on return on equity metrics.
Emerging Trends Shaping Return on Equity Analysis
Let’s break down the major innovations influencing return on equity evaluation in 2025:
| Trend | Description |
|---|---|
| AI-powered analytics | Automates data collection, anomaly detection, and forecasting |
| Real-time ROE dashboards | Live updates from cloud-based accounting and market data |
| ESG integration | Considers environmental, social, and governance factors |
| Regulatory shifts | New standards for equity and net income calculation |
| Alternative data | Uses non-traditional sources for deeper insight |
Artificial intelligence is rapidly changing how return on equity is tracked and forecasted. Automated platforms now scan financial statements, identify trends, and flag potential risks in real time. These systems provide analysts with instant feedback, reducing manual errors and allowing more focus on strategy.
Another key innovation is the rise of real-time ROE dashboards. Companies and investors can now monitor return on equity performance as events unfold, making it easier to respond to market shifts or operational changes. This immediacy is especially valuable in volatile sectors where timing can affect decision-making.
ESG factors are also playing a bigger role in return on equity analysis. Investors increasingly demand transparency around how companies balance profitability with sustainability. As a result, many firms now integrate ESG scores into their ROE assessments, providing a more holistic view of long-term value.
Regulatory changes are reshaping the definition and calculation of return on equity. Updates to accounting standards, particularly around the recognition of intangible assets and treatment of share buybacks, are prompting companies to revisit how they report equity and net income. This is leading to more consistent and comparable ROE figures across industries.
Advanced analytics adoption is rising fast among investment firms. According to recent industry surveys, more than 60% of top asset managers now use AI-driven tools for performance attribution and risk analysis. This shift is expected to accelerate as competition for actionable insights intensifies.
A concrete example of forward-looking ROE strategy can be seen in the reinsurance sector, where firms are leveraging advanced analytics to maintain robust returns. According to reinsurer ROE projections, steady return on equity is expected through 2027, driven by data modeling and risk management innovations.
Looking ahead, the next wave of return on equity analysis will emphasize context and transparency. Investors will increasingly rely on dynamic models that account for both financial and non-financial factors. Companies that adapt quickly to these innovations will be better positioned to attract capital and deliver long-term shareholder value.
Now that you’ve explored the ins and outs of mastering Return on Equity, imagine how much more insightful your analysis could be with access to historical context, AI-powered summaries, and interactive market tools. At Historic Financial News, we believe understanding past market movements can sharpen your strategy and help you spot patterns others might miss. If you’re ready to deepen your financial expertise and shape the future of market analysis, I invite you to Join Our Beta. Let’s bring history to life together—and stay one step ahead in 2025 and beyond.