
Return on Assets Guide: Master ROA Analysis in 2025
Ready to unlock the full potential of your investments in 2025? Understanding return on assets can be the game-changer every investor and financial professional needs for smarter decisions.
This guide is designed to equip you with the tools to understand, calculate, and analyze return on assets. You will gain step-by-step insights, from the basics to advanced strategies, all tailored for today's evolving economy.
Discover key concepts, hands-on calculation methods, real-world examples, industry trends, and actionable steps for optimizing asset efficiency. Dive in to master expert analysis and take confident financial action in the year ahead.
Understanding Return on Assets (ROA)
Return on assets is a foundational concept in financial analysis, serving as a vital measure of how effectively a company leverages its assets to generate profits. In a fast-changing market, understanding this metric helps investors and professionals make sharper, data-driven decisions.
What is ROA and Why It Matters
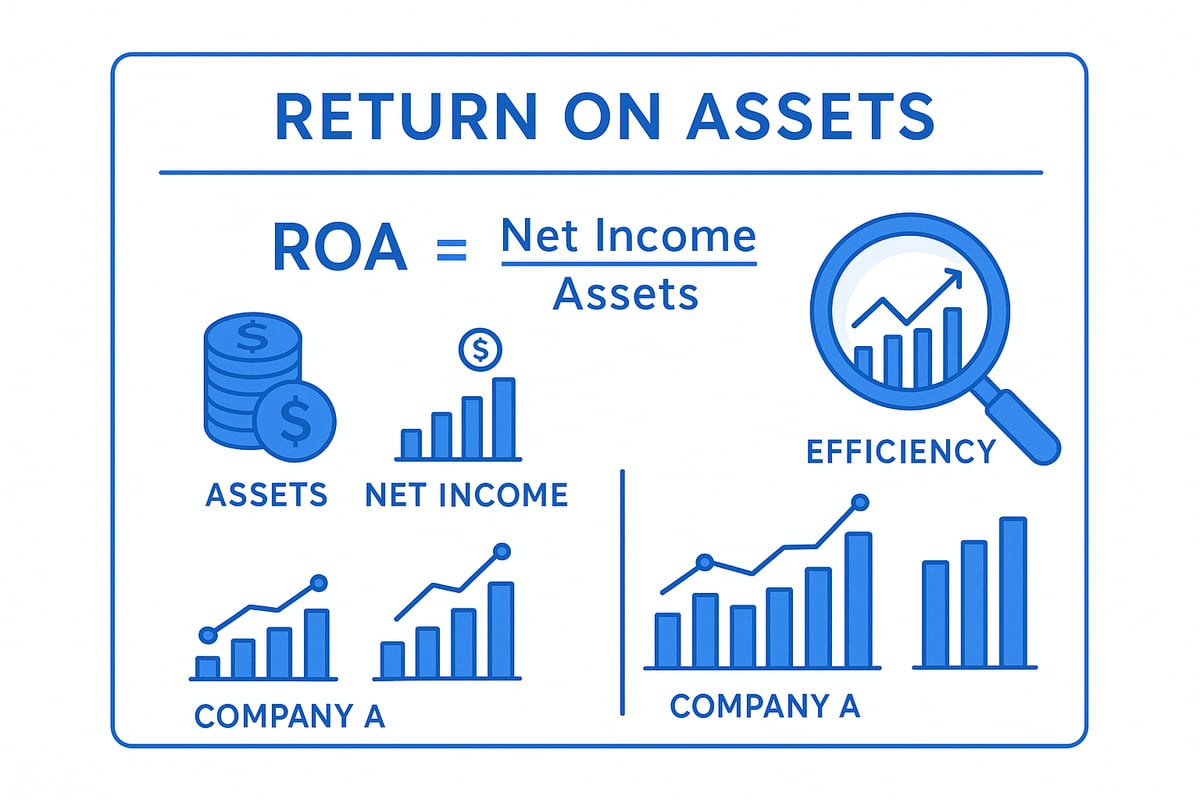
Return on assets measures the efficiency with which a company turns its total assets into net income. In simple terms, it shows how well management is using the resources at its disposal to deliver profits.
This metric is crucial because it levels the playing field when comparing companies of different sizes or across industries. A higher return on assets signals that a business is squeezing more profit out of each dollar invested in assets. For example, consider two companies with identical profits, but one uses half the assets; the company with fewer assets will have a much higher return on assets, indicating better asset utilization.
ROA is also a window into management effectiveness and operational strength. Analysts globally rank return on assets among the top ratios for evaluating financial health. According to the Corporate Finance Institute, it is one of the most widely used metrics by professionals worldwide.
Understanding what counts as an asset is essential. For a deeper dive into the types of assets that form the basis of return on assets calculations and benchmarking, refer to the Tangible Asset Definition and Impact.
ROA Formula Explained
The standard formula for return on assets is:
ROA = Net Income / Average Total Assets
Net income represents the profit left after all expenses, taxes, and interest are paid. Average total assets are calculated by taking the beginning and ending asset values for a given period, usually a year or a quarter, and averaging them. This approach accounts for any significant changes in asset value during the period.
For example, if a company reports net income of $2 million and average total assets of $20 million, the return on assets would be:
ROA = $2,000,000 / $20,000,000 = 0.10 or 10%
Some industries may use adjusted ROA formulas to account for asset-specific factors, such as intangible assets or regulatory requirements. Mastering the formula is key to deeper analysis. Wall Street Prep notes that S&P 500 companies typically report average ROA values ranging from 5 percent to 10 percent, offering a useful benchmark.
ROA vs. Other Profitability Ratios
Return on assets is one of several profitability ratios, each with a unique angle. While ROA focuses on how well assets generate income, return on equity (ROE) measures returns to shareholders, and return on investment (ROI) considers project-level gains. Return on capital employed (ROCE) assesses the efficiency of all capital in use.
| Ratio | Focus Area | Best Use Case |
|---|---|---|
| ROA | Asset efficiency | Comparing asset-heavy firms |
| ROE | Shareholder returns | Assessing leverage impact |
| ROI | Project profitability | Investment decisions |
| ROCE | Capital efficiency | All sources of capital |
For instance, a company might post a high ROE but a low return on assets if it is heavily leveraged. This scenario could signal risk, as the company relies more on debt than operational efficiency. In asset-intensive sectors, such as manufacturing or utilities, return on assets is a favored metric, as highlighted by CFI. Integrating these ratios provides a more holistic financial view.
Limitations and Considerations
Despite its strengths, return on assets has limitations. Accounting methods, such as different depreciation schedules or asset valuation techniques, can skew results and reduce comparability. Non-operating items, like gains from asset sales, may inflate net income and distort the metric.
Industry differences matter. Banks, for example, define assets differently from manufacturers, making direct comparisons less meaningful. Tech companies, with significant intangible assets, may show a return on assets that does not reflect their true operational power.
Analysts recommend using return on assets alongside other metrics and adjusting for extraordinary items for a clearer picture. Reviewing footnotes in financial statements often reveals crucial asset adjustments. Financial experts stress the importance of context and careful interpretation when relying on return on assets for strategic decision-making.
Step-by-Step Guide: Calculating and Interpreting ROA in 2025
Unlocking the power of return on assets requires a disciplined, stepwise approach. This guide walks you through each essential phase, ensuring your analysis is accurate, insightful, and actionable for 2025. Use these steps to master ROA and make informed financial decisions.
Step 1: Gather Accurate Financial Data
The first step in calculating return on assets is ensuring the quality and reliability of your financial data. Start by sourcing audited financial statements, such as annual reports or SEC filings. These documents provide verified figures for net income and total assets.
Always use average total assets for the period under review. Calculate this by averaging the beginning and ending asset balances from the balance sheet. For instance, if a company reports $10 million in assets at the start of the year and $14 million at the end, the average is $12 million.
Pay special attention to any restatements or reclassifications in the financials. These changes can impact your return on assets calculation and potentially distort trends.
Tips for data gathering:
- Confirm data sources are up-to-date and audited.
- Cross-check figures between different reports.
- Note any large asset purchases, sales, or write-downs.
Remember, accurate data is the foundation for meaningful return on assets insights.
Step 2: Calculate Net Income
Net income represents the company’s total profit after all expenses, taxes, and costs. To get a true picture for return on assets analysis, it’s critical to adjust net income for any one-time or non-recurring items.
For example, if a company sold a building for a significant gain, that income should be subtracted to reveal ongoing profitability. Similarly, discontinued operations or extraordinary gains and losses must be excluded.
A clean net income figure gives a more accurate view of management’s performance and asset efficiency. Relying on unadjusted net income can inflate or distort your return on assets, especially if non-operating gains are significant.
Check the notes to the financial statements for disclosures about unusual items. Adjusting net income ensures your return on assets calculation reflects true operational results.
Step 3: Compute Average Total Assets
With net income in hand, the next step is to determine average total assets for the period. This smooths out fluctuations and gives a more balanced view for return on assets analysis.
Use the formula:
Average Total Assets = (Beginning Assets + Ending Assets) / 2
If the company made significant acquisitions, divestitures, or asset purchases during the year, consider more granular averaging—such as quarterly balances. For example, a mid-year merger can significantly alter the asset base, so a simple average may not accurately reflect actual asset use.
Average assets help neutralize timing effects. Asset-heavy industries, such as manufacturing or utilities, often see double-digit year-over-year changes in asset balances.
In summary, always use average total assets for a precise return on assets calculation, and check for any significant mid-period changes.
Step 4: Apply the ROA Formula
Now, bring your data together to calculate return on assets. The standard formula is:
ROA = Net Income / Average Total Assets
Let’s walk through a sample calculation:
| Item | Amount ($) |
|---|---|
| Net Income | 1,200,000 |
| Beginning Assets | 10,000,000 |
| Ending Assets | 14,000,000 |
| Average Assets | 12,000,000 |
| ROA | 10% |
Plug in the values:
ROA = 1,200,000 / 12,000,000 = 0.10 or 10%
Even small changes in return on assets can reveal shifts in operational efficiency or profitability. Comparing your result with industry averages helps determine if performance is strong or needs improvement.
If your return on assets falls below the sector benchmark, it may indicate underutilized assets or inefficiencies that require further investigation.
Step 5: Interpret and Benchmark Results
With your return on assets calculated, the next step is interpretation and benchmarking. Start by comparing your result to industry averages and your company’s historical performance. Benchmarking tools and databases can provide context for your results.
For example, technology companies typically report higher return on assets than manufacturers due to lighter asset bases. Track your ROA over several periods to spot positive or negative trends.
Outliers in return on assets may signal accounting changes, asset write-downs, or strategic shifts. Use tools like DuPont analysis to break down ROA into profit margin and asset turnover for deeper insights.
To benchmark effectively, reference detailed ROA statistics by sector from resources like Return on Assets by Industry: 2025 Performance Data. This ensures your comparisons are current and relevant.
Remember, return on assets is just one piece of the puzzle. Combine it with other financial ratios to create a comprehensive analysis. By consistently applying and interpreting return on assets, you gain valuable insight into management efficiency and asset utilization—crucial for navigating the financial landscape of 2025.
Real-World ROA Analysis: Case Studies and Applications
Unlocking the practical power of return on assets means understanding how it operates across real industries and scenarios. By examining case studies, trends, advanced techniques, and common errors, you can master ROA analysis for any business environment.
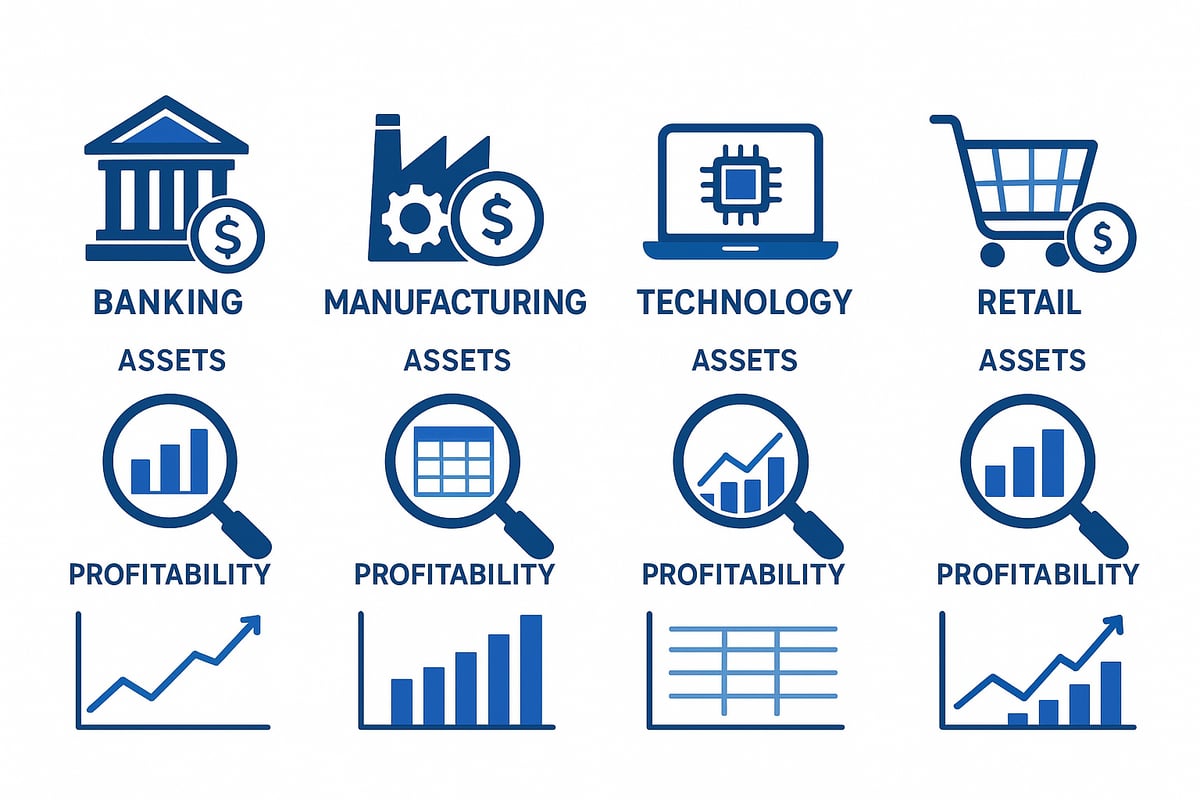
ROA in Different Industries
The return on assets metric is not one size fits all. Its meaning and benchmarks shift significantly across sectors. In manufacturing, companies like Ford manage large inventories and heavy machinery, resulting in a high asset base and a moderate return on assets. In contrast, technology leaders such as Apple operate with fewer physical assets, often achieving a higher return on assets due to their asset-light model.
Banking presents a unique case. Here, assets consist mainly of loans and financial instruments, and regulatory requirements play a major role. Analysts often review both return on assets and net interest margin to get a comprehensive view of bank performance.
Retailers, with inventory-heavy operations, see their return on assets influenced by how quickly they turn over stock. For a quick comparison:
| Industry | Average ROA 2023 | Example Company |
|---|---|---|
| Technology | 15% | Apple |
| Manufacturing | 6% | Ford |
| Banking | 1.2% | JPMorgan Chase |
| Retail | 5% | Walmart |
Understanding each sector’s asset structure is crucial. Comparing Apple and Ford illustrates why context matters: Apple’s lean asset model drives strong ROA, while Ford’s manufacturing footprint naturally lowers it, even with similar profits.
ROA Trends in 2025: What’s Changing?
The financial landscape for return on assets is evolving rapidly as we approach 2025. Rising interest rates are increasing the cost of holding assets, impacting profitability calculations for asset-heavy firms. Meanwhile, the ongoing digital transformation is helping companies shift toward asset-light models, reducing capital requirements and potentially boosting ROA.
Sustainability and ESG initiatives are also influencing asset profiles. Companies are investing in greener technologies and infrastructure, which may temporarily lower return on assets but position them for long-term gains.
Retailers moving from physical stores to e-commerce are a prime example. This shift reduces the need for real estate and inventory, leading to a higher return on assets over time. Industry standards are no longer static. In fact, 40% of S&P 500 companies reported adopting asset-light strategies in 2024, highlighting the need to monitor new benchmarks as they emerge.
Keeping an eye on industry reports will ensure your analysis reflects the latest return on assets trends and expectations.
Advanced ROA Interpretation Techniques
To truly master return on assets analysis, advanced techniques are essential. The DuPont Analysis, for instance, breaks ROA into profit margin and asset turnover, revealing whether low ROA stems from slim margins or sluggish asset use. This method provides a deeper look at operational strengths and weaknesses.
Adjusted ROA takes things further by removing non-operating items, giving a clearer picture of core performance. For example, a one-time gain from selling equipment can inflate ROA if not adjusted out, creating a misleading trend.
Trend analysis is another powerful tool. By tracking return on assets over multiple years, analysts can spot strategic shifts, cyclical changes, or gradual improvements. Companies that embrace advanced analytics often outperform their peers, with those using sophisticated ROA models seeing an 8% performance edge.
Integrating these methods with a disciplined approach ensures your return on assets insights are both accurate and actionable.
Common Pitfalls and How to Avoid Them
Even experienced analysts can stumble when interpreting return on assets. One common mistake is failing to account for changes in accounting policies, such as depreciation methods or asset revaluation, which can distort ROA trends. Ignoring off-balance sheet assets or liabilities, like leases, can also skew the metric.
Another pitfall is overlooking industry cycles. For example, a sudden spike in return on assets might result from an asset write-down, not genuine operational improvement. Consistency in methodology is key for comparability over time and across companies.
To avoid errors, always cross-check return on assets with other financial ratios and review footnotes for asset definitions. Remember, 25% of analyst ROA mistakes are traced to inconsistencies in asset measurement. Balanced, thorough analysis ensures your conclusions are reliable and insightful.
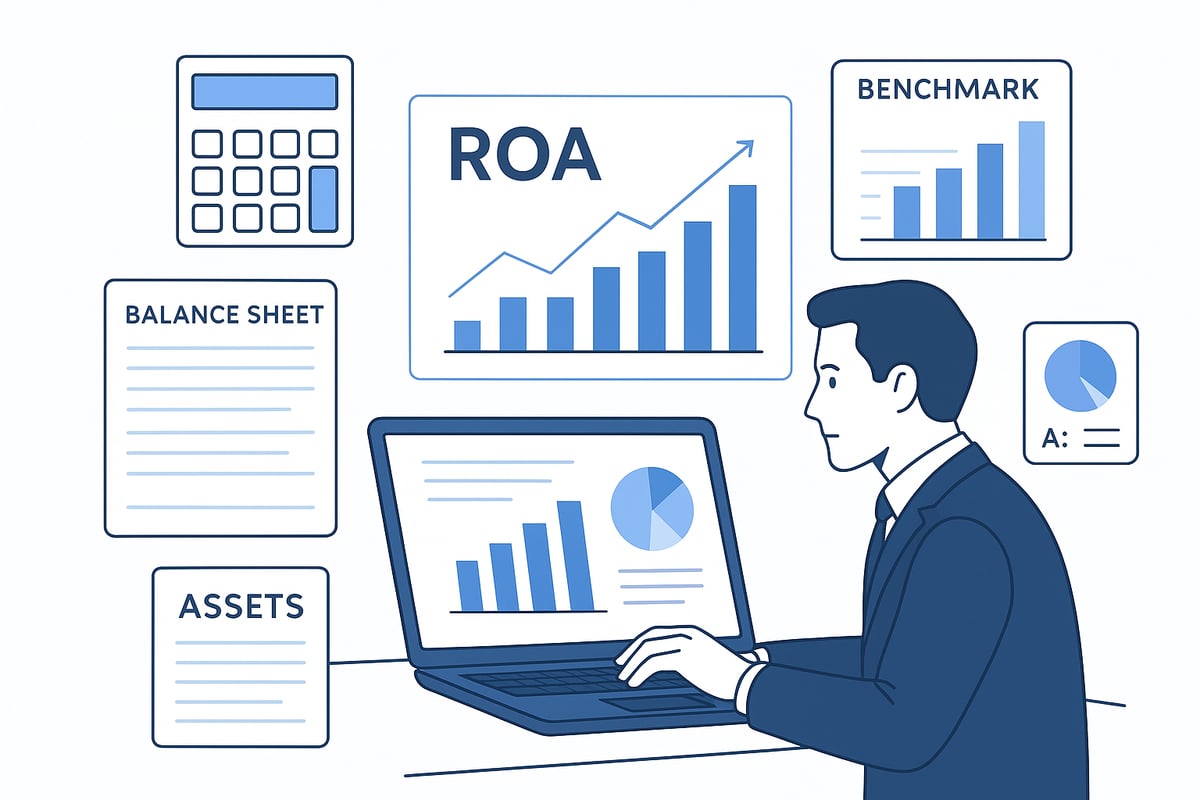
ROA Benchmarking and Competitive Analysis
Effective benchmarking and competitive analysis are essential for unlocking the full value of return on assets in any organization. By systematically comparing ROA across peers and integrating it into broader financial strategies, companies can identify strengths, address weaknesses, and stay ahead in a dynamic market.

Setting Effective ROA Benchmarks
Setting the right benchmarks for return on assets starts with identifying suitable peer groups and industry standards. This process often requires using data from reliable sources such as Bloomberg, S&P Capital IQ, or industry reports. Customizing benchmarks to account for company size, geography, and sector nuances ensures meaningful comparisons.
For example, a mid-cap manufacturing company may benchmark its ROA against similar manufacturers rather than the overall market. Industry ROA benchmarks can vary by as much as 300 percent between sectors, so context is critical. Adjusting for geographic factors or business models helps refine these comparisons.
| Industry | Average ROA (%) | Benchmark Source |
|---|---|---|
| Technology | 12 | S&P Capital IQ (2023) |
| Manufacturing | 6 | Bloomberg (2023) |
| Banking | 1.2 | Wall Street Prep (2023) |
| Retail | 5 | CFI (2023) |
Staying current with evolving trends is vital. As highlighted in Asset Management 2025: The Great Convergence, shifts in asset management and business models are reshaping how organizations set and interpret benchmarks for return on assets.
Using ROA in Peer Comparisons
Peer comparison is a powerful tool for understanding a company's competitive position through the lens of return on assets. By comparing ROA with direct competitors, organizations can pinpoint operational strengths or areas for improvement.
For instance, if a competitor consistently posts higher ROA, it may indicate more efficient asset management or innovative use of resources. However, context matters—comparing ROA across companies with different asset bases or business cycles can lead to misleading conclusions. Peer group ROA spreads often reveal market disruption or inefficiency.
Consider these steps for effective peer comparison:
- Identify direct competitors with similar business models.
- Analyze reasons behind significant ROA deviations.
- Incorporate qualitative factors such as management strategy or market positioning.
Integrating return on assets with peer analysis enables more robust strategic planning and highlights opportunities for outperforming the market.
ROA and Investor Decision-Making
Investors increasingly use return on assets as a key screening tool when evaluating potential investments. ROA helps assess how well a company utilizes its asset base to generate profits, providing insight into operational efficiency and management quality.
Funds that focus on high-ROA stocks have outperformed the S&P 500 by 2.5 percent in 2023, demonstrating the value of this metric in portfolio construction. Investors often look for companies with consistently strong or improving ROA, as this signals sustainable value creation.
ROA trends also serve as early warning indicators. A sudden decline in return on assets may prompt closer examination of asset utilization, signaling strategic shifts or operational issues that could impact long-term returns.
Integrating ROA with Other Financial Metrics
While return on assets provides a holistic view of asset efficiency, integrating it with ratios such as return on equity, ROI, and ROCE offers a more complete financial picture. This multi-metric approach is especially valuable for CFOs and analysts managing complex portfolios.
For example, using both ROA and ROE can help assess the impact of leverage, while combining ROA with operating margin reveals the interplay between profitability and asset use. Dashboards that track several ratios simultaneously enable faster, more informed decision-making.
According to CFI, 85 percent of Fortune 500 companies employ integrated ratio analysis to guide financial strategy. Leveraging technology tools for automated analysis streamlines the process and ensures that return on assets remains a central pillar of financial performance assessment.
Optimizing and Improving ROA: Strategies for 2025
Unlocking higher return on assets in 2025 demands a blend of operational discipline, strategic foresight, and technological adoption. As the economic landscape evolves, organizations must rethink how every asset contributes to profitability. Below, we break down actionable strategies and best practices for maximizing return on assets in the year ahead.
Internal Strategies to Boost ROA
Improving return on assets starts with getting more from every resource. Companies should focus on operational excellence, cost optimization, and effective capital allocation. Streamlining processes, cutting unnecessary expenses, and enhancing margins all contribute to stronger results.
- Boost asset turnover: Adopt lean manufacturing, optimize inventory, and reduce idle time.
- Increase margins: Control direct and indirect costs, renegotiate supplier contracts, and eliminate waste.
- Divest underperforming assets: Sell or repurpose assets that do not generate sufficient returns.
For example, a manufacturer implementing lean initiatives could see return on assets increase by 2 percent within a year. According to CFI, companies that reduced their asset base by 10 percent achieved an average ROA improvement of 1.5 percent.
It is essential to monitor capital expenditure closely. Investing wisely in new equipment or technology can improve efficiency, but over-investing may dilute your return on assets. For a deeper understanding of the impact of capital expenditure on asset efficiency, see Capital Expenditure and Asset Efficiency.
Regularly reviewing and benchmarking asset performance ensures that operational changes translate into meaningful gains. Small, consistent improvements compound over time, turning asset efficiency into a true competitive advantage.
Strategic Asset Management
Strategic asset management is central to optimizing return on assets, especially as business models shift toward asset-light strategies. Outsourcing non-core activities, leveraging partnerships, and migrating to cloud-based solutions can reduce the need for heavy physical assets.
- Adopt asset-light models: Shift from ownership to usage through leasing or outsourcing.
- Invest in technology: Replace legacy systems with scalable, cloud-based platforms to improve flexibility and lower capital requirements.
- Reallocate capital: Direct funds to high-yield assets and prune low-performing investments.
A technology company moving core IT infrastructure to the cloud, for instance, can significantly lower its asset base while maintaining or even increasing output. This shift frees up capital for innovation and growth, driving a higher return on assets over time.
Industry leaders report that 60 percent of top-performing firms have embraced asset-light strategies as of 2024. By continuously assessing asset utilization, organizations can strike the right balance between growth and efficiency.
The Role of Technology and AI in ROA Optimization
Technology and AI are rapidly transforming how companies manage, monitor, and optimize their assets. Predictive analytics allows businesses to anticipate maintenance needs, optimize asset deployment, and reduce downtime.
- Predictive analytics: Use data to forecast equipment failures and schedule proactive maintenance.
- AI-driven optimization: Automate routine asset management, from inventory control to resource allocation.
- Lifecycle management: Track asset performance from acquisition through disposal to maximize value.
For example, manufacturers using AI-powered maintenance systems have seen reductions in equipment downtime, directly boosting asset productivity and return on assets. According to Wall Street Prep, leading companies using AI improved ROA by up to 3 percent.
Investing in digital transformation is no longer optional. Firms that prioritize technology integration are better positioned to sustain high returns on assets in a competitive market.
Aligning ROA Goals with Corporate Strategy
Optimizing return on assets is most effective when it is fully aligned with the organization’s broader objectives. This means setting clear ROA targets, integrating them into departmental goals, and communicating expectations at every level.
- Set ROA-based KPIs: Tie management incentives and bonuses to improvements in return on assets.
- Foster cross-department collaboration: Ensure finance, operations, and strategy teams work together.
- Monitor and report progress: Use dashboards and regular updates to keep ROA front of mind.
For instance, organizations that align executive compensation with ROA improvements have experienced profit growth 12 percent higher than their peers, according to CFI. When everyone is focused on the same performance metrics, the entire organization moves in sync toward maximizing asset efficiency.
By embedding return on assets into the corporate DNA, businesses can drive sustained value creation for shareholders and stakeholders alike.
Mastering ROA Analysis: Tools, Resources, and Best Practices
Unlocking the full power of return on assets analysis requires more than just formulas. It demands the right tools, consistent monitoring, and a commitment to ongoing learning. In this section, we explore proven techniques and resources to help you master return on assets in 2025 and beyond.
Essential ROA Analysis Tools and Software
Selecting the right tools is the foundation of effective return on assets analysis. Today, financial modeling platforms like Excel, Power BI, and Tableau are indispensable for calculating, visualizing, and tracking ROA across portfolios. These platforms allow you to automate data imports, create dynamic dashboards, and minimize manual errors.
Specialized ROA calculators, such as those offered by Wall Street Prep, further streamline the process. These tools are particularly valuable when handling complex financial statements or benchmarking against industry peers. For a holistic view, consider integrating ROA analysis with other key metrics like Understanding Operating Margin, which provides critical context for profitability.
Here is a quick comparison of leading ROA analysis tools:
| Tool | Strengths | Best For |
|---|---|---|
| Excel | Customization, flexibility | Detailed modeling |
| Power BI | Real time dashboards, visuals | Executive reporting |
| Tableau | Advanced analytics, integration | Portfolio management |
According to CFI, 90% of analysts now use digital tools for ratio analysis, making technology essential for mastering return on assets.
Best Practices for Ongoing ROA Monitoring
Consistent monitoring is crucial for maintaining healthy return on assets metrics. Establish regular review cycles—monthly, quarterly, and annually—to spot trends and respond proactively to changes in asset utilization or profitability.
Set up dashboard alerts for significant shifts in ROA. This enables management to investigate root causes quickly, whether they stem from asset write-downs, operational inefficiencies, or market disruptions. Executive teams benefit from summary dashboards that visualize ROA alongside peer benchmarks and historical data.
Firms with real-time ROA monitoring have reduced unexpected asset write-downs by 8 percent, according to Wall Street Prep. Embedding return on assets tracking into your management routines helps prevent negative surprises and keeps everyone aligned with strategic goals.
Professional Development and Certification
Mastering return on assets is not just about tools. It also requires continuous professional development. Industry-recognized certification programs, such as those offered by CFI and Wall Street Prep, provide structured training in ROA calculation, interpretation, and benchmarking.
Earning credentials like the Financial Modeling & Valuation Analyst (FMVA®) demonstrates expertise in return on assets analysis, making you more valuable to employers or clients. Staying current with accounting standards, industry trends, and new analytical techniques ensures your skills remain sharp and relevant.
Certified analysts are 25 percent more likely to identify opportunities for improving return on assets, according to CFI. This ongoing education is a powerful driver for both personal growth and organizational performance.
Common ROA Analysis Mistakes to Avoid
Even seasoned professionals can make mistakes when analyzing return on assets. One common pitfall is overreliance on ROA without considering the broader financial context. For example, ignoring qualitative factors like management changes or industry cycles can lead to misleading conclusions.
Another frequent error is not adjusting for one time events or changes in accounting methods, which can distort the ROA calculation. In asset heavy sectors, overlooking off balance sheet assets or liabilities can also result in inaccurate assessments.
Learning from past errors is essential. According to Wall Street Prep, 30 percent of failed investments cite misjudged return on assets as a contributing factor. Always cross check ROA results with other profitability metrics and narrative insights for a balanced view.
Future Trends: The Evolution of ROA in Financial Analysis
The landscape for return on assets analysis is shifting rapidly. ESG and sustainability metrics are influencing how companies evaluate their assets, while intangible assets—such as intellectual property and data—are becoming a larger share of corporate value.
Tech firms are leading this evolution, prompting a redefinition of what constitutes an asset for benchmarking purposes. According to CFI, 50 percent of new S&P 500 assets are now intangible, highlighting the need for updated approaches to return on assets.
Looking ahead, market outlooks like the 2025 Annual Global Market Outlook provide valuable context for asset performance and evolving ROA benchmarks. Adapting your analysis to these changes will ensure your return on assets insights remain relevant and actionable in the years to come.
As you master ROA analysis and sharpen your financial decision-making for 2025, imagine having a platform where you can explore historical market data, uncover patterns, and learn from past successes and setbacks. With Historic Financial News, you gain interactive charts, AI-powered insights, and original news coverage all designed to empower your journey as an investor, student, or financial enthusiast. If you're ready to take your understanding of asset efficiency to the next level—and help shape a tool built for future-focused minds—Join Our Beta and be part of a community bringing financial history to life.