
Regression Analysis Guide 2026: Unlocking Data Insights
In 2026, data-driven decisions shape the success of every business, research project, and strategic initiative. The sheer volume of information available today means that extracting meaningful insights is not just valuable, but essential.
This is where regression analysis comes into play. By revealing patterns and relationships hidden within complex datasets, it empowers professionals to make smarter, evidence-based decisions.
This guide will walk you through the essentials of regression analysis, from foundational concepts and step-by-step processes to avoiding common pitfalls and exploring real-world applications. Whether you are a beginner or an expert, you will gain actionable strategies and future-focused tips to maximize your data’s potential.
Ready to transform your approach and unlock new insights? Dive in and discover how regression analysis can drive impactful results in your field.
Understanding Regression Analysis: Core Concepts and Types
In today's data-driven landscape, regression analysis stands as a cornerstone of statistical modeling. It empowers professionals to decode complex relationships within data, making it an essential tool for prediction and strategic insight.

What is Regression Analysis?
Regression analysis is a statistical method used to estimate the relationship between variables. At its core, it helps researchers and decision-makers understand how changes in one or more independent variables influence a dependent variable.
The primary goal of regression analysis is to identify, measure, and predict the impact of these variables. For instance, a business might use regression analysis to predict sales based on marketing spend. This approach helps allocate resources efficiently and forecast future trends with greater confidence.
Historically, regression analysis has evolved from early mathematical concepts to a critical component of modern analytics. Its relevance continues to grow as organizations rely more on data to guide decisions. In 2026, regression analysis is indispensable for uncovering patterns and making informed choices.
By modeling relationships, regression analysis transforms raw data into actionable insights. Whether in business, healthcare, or social sciences, its versatility and predictive power make it a go-to method for data exploration and forecasting.
Types of Regression Analysis
There are several forms of regression analysis, each suited to different data structures and research objectives. Understanding these types is key to selecting the right method for your analysis.
| Type | Description | Example Use Case |
|---|---|---|
| Simple Linear Regression | One independent and one dependent variable; straight-line relationship | Predicting sales from ad spend |
| Multiple Linear Regression | Multiple independent variables, one outcome | Analyzing factors in house prices |
| Multivariate Regression | Multiple dependent variables analyzed together | Health outcomes in a study |
| Logistic Regression | Predicts binary outcomes (yes/no) | Credit approval decisions |
| Nonlinear Regression | Models curved relationships | Biological growth rates |
| Specialized Methods | Includes robust, quantile, and nonparametric regressions | Handling outliers or non-normal data |
Simple linear regression is ideal for exploring a single predictor and outcome, while multiple linear regression accommodates several predictors. Multivariate regression extends this to multiple outcomes, offering a more comprehensive view. Logistic regression is tailored for binary results, such as win or lose scenarios. Nonlinear regression addresses relationships that do not follow a straight line. Specialized techniques, like robust and nonparametric regression, tackle unique data challenges.
Regression analysis is used extensively across industries. According to Qualtrics, it is one of the most common statistical techniques in market research, business analytics, and healthcare studies. For a deeper dive into practical applications and advanced methods, see Regression Techniques for Data Analysis.
Key Terminology and Assumptions
To use regression analysis effectively, understanding its terminology and underlying assumptions is crucial.
Key Terms:
- Dependent Variable: The outcome being predicted or explained.
- Independent Variable: The predictor or factor believed to influence the dependent variable.
Core Assumptions:
- Linearity: Relationship between variables is linear.
- Independence: Observations are independent of each other.
- Homoscedasticity: Variance of residuals remains constant across values.
- Normality: Residuals follow a normal distribution.
Violating these assumptions can lead to misleading results. For example, if independent variables are highly correlated, or the relationship is not linear, the analysis might produce spurious correlations. This is why careful data preparation and model selection are vital.
By mastering terminology and checking assumptions, professionals ensure their regression analysis yields reliable, actionable insights for any field.
The Regression Analysis Process: Step-by-Step Guide
Unlocking the power of regression analysis starts with a structured, methodical approach. By following each step, you ensure your findings are robust, actionable, and relevant. Let’s walk through the complete process together, so you can apply these techniques confidently in your own work.
Step 1: Defining the Research Question and Selecting Variables
Every successful regression analysis begins with a clear, focused research question. Ask yourself: What outcome am I trying to predict or explain?
Next, identify your dependent variable (the main outcome) and independent variables (potential predictors). For example, if you want to analyze factors influencing customer satisfaction scores, your dependent variable is the satisfaction score, while independent variables could include response time, product quality, and price.
Clarity at this stage sets the foundation for meaningful results and minimizes confusion later in the process.
Step 2: Data Collection and Preparation
Gathering high-quality, relevant data is essential for effective regression analysis. Begin by sourcing information from reliable databases, surveys, or business records.
Data preparation involves cleaning and preprocessing. Address missing values, outliers, and inconsistencies. Normalize data if variables are on different scales. Ensuring your sample is representative helps avoid bias.
For financial modeling, you might collect quarterly sales and marketing spend, referencing key figures from the income statement fundamentals. This ensures your regression analysis is built on accurate, business-critical variables.
Step 3: Choosing the Appropriate Regression Model
The choice of model depends on your research goal and the nature of your variables. Ask: Is the outcome continuous or categorical? Are there multiple predictors or outcomes?
Common options include:
- Simple linear: One predictor, one outcome.
- Multiple linear: Several predictors, one outcome.
- Logistic: Predicting binary results.
- Multivariate: Multiple dependent variables.
Suppose you want to predict whether a customer will renew a subscription (yes/no). Logistic regression analysis is the right tool. Choose your model carefully to align with both your data and objectives.
| Model Type | Use Case | Outcome Variable Type |
|---|---|---|
| Simple Linear | Sales vs. ad spend | Continuous |
| Multiple Linear | Revenue from multiple factors | Continuous |
| Logistic | Pass/fail, churn/no churn | Categorical |
| Multivariate | Multiple outcomes | Continuous |
Step 4: Conducting the Analysis
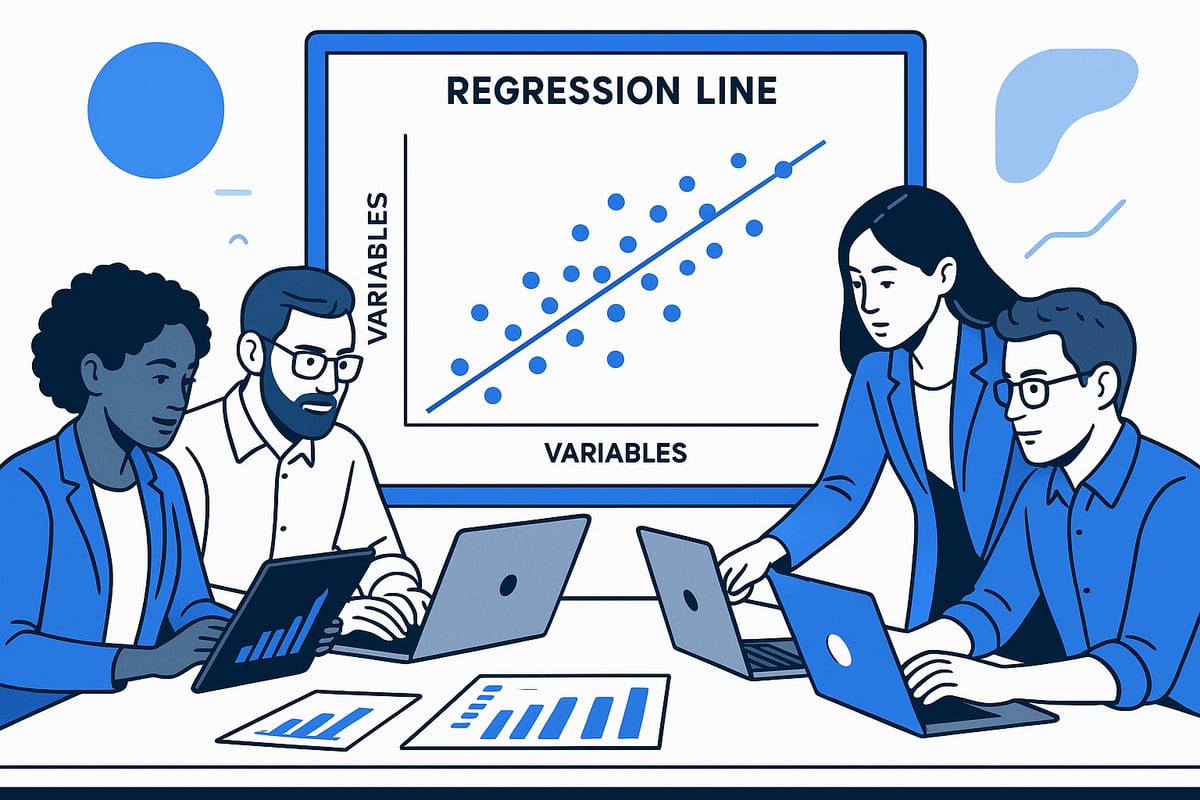
Start by visualizing your data with scatter plots and regression lines. This helps identify patterns and potential anomalies.
Use statistical software such as R, Python, or SPSS to run your regression analysis. Interpret the regression coefficients—they show how much each independent variable influences the outcome. Check significance levels (p-values) to determine which predictors are meaningful.
For example, plotting ad spend against revenue can reveal the strength of their relationship. Here’s a sample output in Python:
import statsmodels.api as sm
X = data['ad_spend']
y = data['revenue']
X = sm.add_constant(X)
model = sm.OLS(y, X).fit()
print(model.summary())
Step 5: Evaluating Model Fit and Validity
Assessing how well your regression analysis fits the data is crucial. Key metrics include R-squared (explained variance), Adjusted R-squared (accounts for number of predictors), and p-values (statistical significance).
Always check residuals for patterns or outliers. Systematic patterns may indicate issues with your model or data. Validate assumptions: linearity, independence, and homoscedasticity.
A high R-squared value suggests your model explains much of the variance in the outcome, giving you confidence in its predictive power.
Step 6: Making Predictions and Drawing Insights
Once your regression analysis is validated, use the model to make predictions or forecast future trends. Apply the coefficients to new data and estimate likely outcomes.
Translate these results into actionable business recommendations. For instance, if the model shows that increasing marketing investment drives higher sales, you can justify budget adjustments to stakeholders.
Regression analysis turns statistical findings into real-world decisions, bridging the gap between data and strategy.
Step 7: Communicating and Visualizing Results
Effective communication is the final step. Present your findings with clarity, using visual aids like charts, graphs, or dashboards. Highlight key relationships, significant predictors, and practical implications.
Best practices include:
- Summarizing main findings in plain language
- Using visuals to make complex results accessible
- Tailoring the presentation to your audience
Whether you’re sharing with executives or technical teams, clear communication ensures your regression analysis delivers maximum impact.
Common Pitfalls and How to Avoid Them
Navigating regression analysis can be complex, even for seasoned professionals. Small missteps often lead to unreliable results or misleading insights. By understanding common pitfalls and applying best practices, you can ensure your regression analysis remains robust, accurate, and actionable.

Misinterpreting Correlation and Causation
A frequent mistake in regression analysis is confusing correlation with causation. Just because two variables move together does not mean one causes the other. For example, ice cream sales may correlate with drowning incidents, but there is no causal relationship. Both are influenced by a third factor, such as temperature. Understanding this distinction is crucial for drawing valid insights from regression analysis. Always investigate underlying mechanisms before making causal claims.
Overfitting and Underfitting Models
Overfitting occurs when a regression analysis model is too complex, capturing noise rather than the true pattern. Underfitting happens when the model is too simple, missing essential relationships. Both result in poor predictive performance. Techniques like cross-validation and regularization help balance model complexity. By properly tuning your regression analysis, you can avoid these extremes and improve reliability. Always test your model on new data to check its real-world applicability.
Ignoring Assumptions or Data Quality Issues
Every regression analysis relies on key assumptions: linearity, independence, homoscedasticity, and normality. Ignoring these can produce biased or invalid results. Data quality is equally important. Outliers, missing values, or non-representative samples can skew findings. Always assess your data before analysis and check that assumptions hold. If they are violated, explore data transformations or alternative models. A careful approach ensures your regression analysis produces trustworthy insights.
Multicollinearity and Variable Selection
Multicollinearity arises when independent variables in regression analysis are highly correlated with each other. This can inflate variance and make it difficult to interpret results. To address this, use techniques like variance inflation factor (VIF) analysis or stepwise regression. Recent advances, such as those described in Scalable Variable Selection in Latent Regression Models, offer sophisticated methods for selecting the right variables, especially in complex or high-dimensional data sets. Prudent variable selection is vital for meaningful regression analysis outcomes.
Misuse of Regression for Inappropriate Data Types
Regression analysis is powerful, but only when used with suitable data and relationships. Applying linear regression to categorical outcomes or non-linear relationships without proper modeling leads to misleading results. For example, predicting a yes/no outcome with linear regression is inappropriate; logistic regression should be used instead. Always match your regression analysis method to the data structure and research question. This ensures your conclusions remain valid and actionable.
Best Practices for Reliable Results
To maximize the value of regression analysis, adopt these best practices:
- Validate models with fresh data sets.
- Document your methodology and assumptions for transparency.
- Seek peer review or expert consultation to check findings.
By consistently applying these steps, you can avoid common pitfalls and ensure your regression analysis delivers insights that are both credible and impactful.
Real-World Applications and Case Studies
In 2026, regression analysis is at the core of data-driven strategies across industries. Organizations rely on this statistical powerhouse to uncover patterns, quantify relationships, and drive confident decisions. Let us explore how regression analysis transforms real-world scenarios, from business boardrooms to public policy.

Business and Market Analysis
Regression analysis is a cornerstone in business forecasting and market intelligence. Companies use it to predict sales, revenue, and trends by analyzing how various factors, like marketing spend, influence outcomes. For example, a retail firm may apply multiple regression analysis to estimate future revenue based on advertising budgets, seasonal trends, and consumer sentiment.
This approach also aids in evaluating operational efficiency. By leveraging regression analysis, organizations can forecast profitability and optimize resource allocation. For deeper insights into how profitability metrics can be predicted and analyzed, see operating margin and profitability metrics.
Healthcare and Social Sciences
In healthcare, regression analysis is instrumental in predicting patient outcomes and public health trends. Researchers often employ multivariate regression to assess how multiple interventions impact health indicators. For instance, a hospital might analyze how medication, therapy, and demographic variables collectively influence recovery rates.
Social scientists rely on regression analysis to disentangle complex relationships within populations. By understanding which factors most strongly affect outcomes, policymakers can design targeted interventions that improve public well-being.
Financial Services and Risk Assessment
Financial institutions depend on regression analysis for credit scoring, fraud detection, and investment evaluation. Logistic regression, in particular, is widely used to predict binary outcomes such as loan defaults. A bank may build a model using applicant income, credit history, and debt ratios to estimate the probability of repayment.
Regression analysis also underpins risk assessment models, helping firms quantify exposure and make informed lending or investment decisions. By identifying key predictors, organizations can allocate resources more effectively and minimize financial risk.
Technology and Product Development
Technology companies harness regression analysis to optimize product features and enhance user experiences. In A/B testing, analysts use regression models to quantify the impact of new features on customer retention or engagement. For example, a software firm might run experiments and use regression analysis to determine which updates most effectively boost user satisfaction.
Product managers also rely on regression analysis to forecast demand and prioritize development resources. By analyzing historical usage data, teams can make evidence-based decisions that align with market needs.
Education and Policy Making
In education, regression analysis is vital for evaluating program effectiveness and guiding resource allocation. Administrators analyze how variables such as funding, class size, and student-teacher ratios impact performance metrics. For instance, a district might use regression analysis to estimate the effect of increased funding on standardized test scores.
Policy makers leverage regression analysis to design interventions that address systemic challenges. For further reading on advanced real-world applications, consult The SAGE Handbook of Regression Analysis and Causal Inference, which explores these methods in detail.
Across all sectors, regression analysis continues to be a trusted tool for unlocking actionable insights, driving innovation, and shaping strategic decisions.
Essential Tools and Resources for Regression Analysis in 2026
Harnessing the right tools is central to maximizing the potential of regression analysis. In 2026, the landscape is richer and more accessible, with developments that empower analysts, researchers, and business leaders to extract deeper insights from their data.
Leading Software and Platforms
Selecting the right platform is the first step in effective regression analysis. Today, both open-source and enterprise solutions offer robust capabilities:
- R and Python: Preferred for advanced statistical modeling, these programming languages provide extensive libraries for regression analysis.
- SPSS, SAS, Stata: Enterprise options with user-friendly interfaces, ideal for large organizations.
- Excel: A go-to for basic regression analysis, especially in business settings.
- Cloud-based analytics platforms: Enable seamless integration with big data and AI, supporting scalable regression analysis projects.
Many professionals also use supplementary techniques like the moving average in financial analysis, which often works alongside regression analysis to reveal underlying trends. Choosing the right software ensures a foundation for accurate and actionable results.
AI and Automation in Regression Analysis
Artificial intelligence is rapidly transforming regression analysis. Machine learning algorithms now automate model selection, validation, and even data cleaning. This reduces manual effort and helps users avoid common errors.
AI-powered platforms can flag anomalies, suggest the best-fit models, and deliver real-time insights. For example, new research such as Projection-Based Multifidelity Linear Regression demonstrates how multifidelity methods can enhance the accuracy of linear regression in data-scarce and high-dimensional environments.
These advancements make regression analysis more accessible to non-technical users while increasing reliability for seasoned analysts.
Data Visualization and Communication Tools
Communicating the results of regression analysis is as important as the analysis itself. Modern visualization tools help transform raw data into actionable insights:
- Dashboards: Tools like Tableau and Power BI enable interactive exploration of regression analysis results.
- Charts and graphs: Visual elements clarify complex relationships and trends.
- Automated reporting: Platforms generate easy-to-understand summaries and insights for stakeholders.
Many analysts combine regression analysis with trend-identifying techniques, such as moving averages, to enhance presentations and drive strategic decisions. The right visual tools ensure findings are clear and persuasive.
Training and Learning Resources
Continuous learning is essential for mastering regression analysis. In 2026, a wealth of resources is available for all skill levels:
- Online courses and certifications: Platforms like Coursera, edX, and Udemy offer targeted regression analysis programs.
- Tutorials and webinars: Regularly updated content helps users stay current with emerging methods.
- Books and academic journals: In-depth materials for those seeking a deeper understanding of regression analysis.
Investing in education ensures both individuals and organizations stay competitive in the evolving analytics landscape.
Trends and Future Directions
The future of regression analysis is shaped by the integration of machine learning and predictive analytics. Automated solutions are increasingly common, offering real-time analysis and decision support.
Explainable AI is gaining traction, making regression analysis models more transparent and understandable. Business intelligence dashboards now provide automated regression analysis, allowing leaders to make data-driven decisions with confidence.
As AI adoption grows, regression analysis is set to become even more integral to strategic planning across industries.
Key Considerations for Tool Selection
When choosing tools for regression analysis, several factors come into play:
- Scalability: Can the tool handle your current and future data needs?
- User support: Is there adequate documentation and community assistance?
- Data security: Does the platform comply with industry regulations?
- Integration: Will the tool work seamlessly with existing data sources and workflows?
- User expertise: Match the platform’s complexity to the team's skill level.
Selecting the right tool for regression analysis ensures efficiency, accuracy, and long-term value.
As we’ve explored in this guide, regression analysis is more than just a statistical tool—it’s your gateway to understanding the forces behind market movements and making smarter, data-driven decisions. If you’re ready to take your skills further and see how historical patterns can shed new light on today’s financial questions, we invite you to be part of our journey. Join our beta and help us bring history to life—you’ll get early access to interactive charts, AI-powered summaries, and expert insights tailored to your needs.
Join our beta and help us bring history to life