
Producer Price Index: Historical Analysis Guide
Understanding economic indicators through their historical performance provides investors and analysts with critical context for interpreting current market conditions. The producer price index serves as one of the most important measurements of inflationary pressure in an economy, tracking price changes at the wholesale level before they reach consumers. By examining how this index has behaved during various economic cycles, recessions, and boom periods since its inception, market participants gain valuable insights into pricing dynamics, supply chain pressures, and the broader economic environment. For those studying financial history, the producer price index offers a window into understanding how production costs have evolved and influenced both business decisions and investment strategies across different eras.
What the Producer Price Index Measures
The producer price index quantifies the average change over time in selling prices received by domestic producers for their output. Unlike consumer-focused metrics, this index captures price movements at earlier stages of the production and distribution chain. The U.S. Bureau of Labor Statistics has tracked this data since 1902, making it one of the longest-running economic time series available for historical analysis.
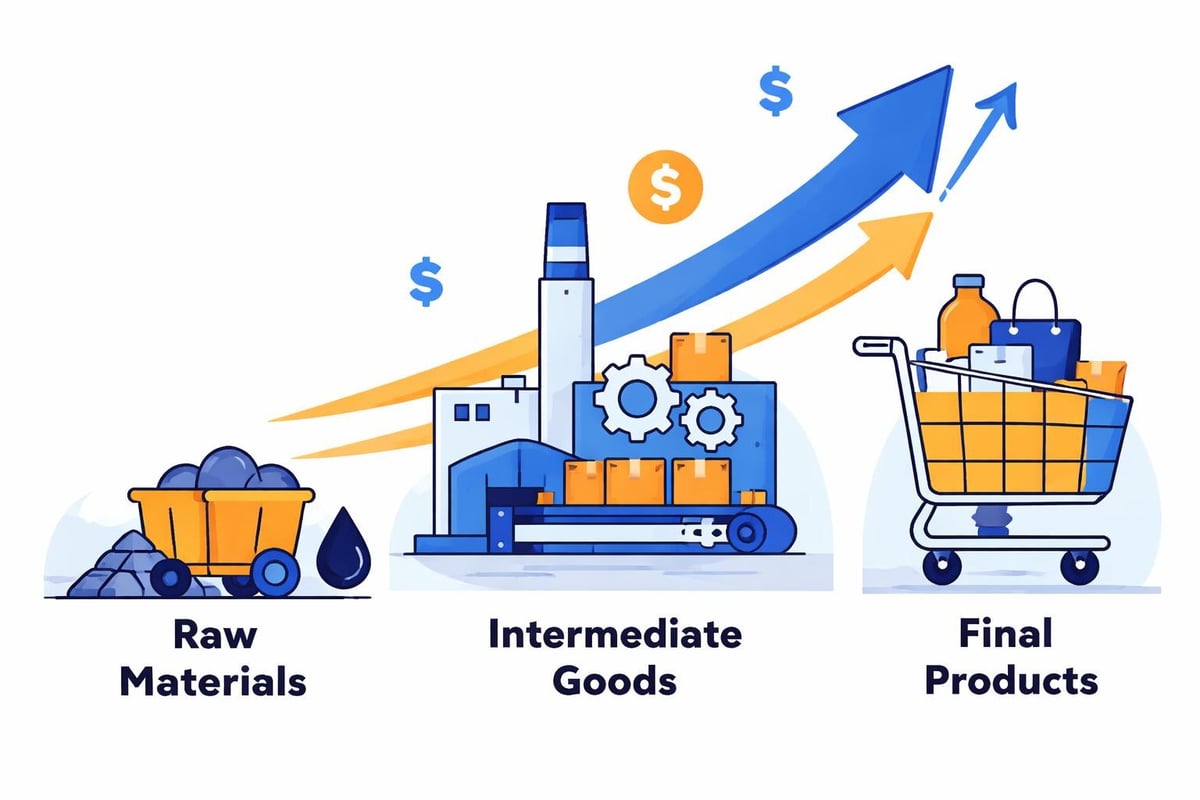
The index encompasses three primary classification structures that provide different perspectives on price changes:
- Industry-based organization tracks prices received by specific industries for their output
- Commodity-based structure organizes price data by product categories regardless of industry
- Final demand-intermediate demand system separates goods and services by their use
This comprehensive measurement framework allows researchers to isolate price pressures at various production stages. When examining historical trends, understanding these different classifications helps identify whether inflation originates from raw material costs, manufacturing processes, or distribution channels.
Components and Coverage
The producer price index includes approximately 10,000 individual product categories and over 100,000 price quotations collected monthly. This extensive coverage spans manufacturing, agriculture, mining, services, and construction sectors. The basis point movements in this index can signal significant shifts in economic conditions.
| Category | Coverage | Historical Significance |
|---|---|---|
| Final Demand | Goods and services sold to end users | Best predictor of consumer inflation |
| Intermediate Demand | Inputs for further production | Early warning for cost pressures |
| Crude Materials | Unprocessed goods | Most volatile, commodity-driven |
The weighting system reflects the relative importance of each component in total production value, which changes periodically to match evolving economic structures.
Historical Evolution and Methodology Changes
Since its establishment in the early 20th century, the producer price index has undergone numerous methodological refinements to improve accuracy and relevance. The index originally focused primarily on goods, but service sector expansion necessitated broader coverage beginning in the 1980s. According to the UK's Office for National Statistics PPI methodology, international standards have evolved similarly across developed economies.
Major historical revisions include:
- Transition from Wholesale Price Index terminology in 1978
- Introduction of industry-based classification in 1986
- Expansion of services coverage throughout the 1990s and 2000s
- Implementation of final demand-intermediate demand system in 2014
These changes mean that comparing producer price index data across distant time periods requires understanding structural breaks in the series. Researchers analyzing century-long trends must account for these methodological shifts when identifying genuine economic patterns versus measurement artifacts.
Seasonal Adjustment Considerations
Many producer price index components exhibit seasonal patterns that complicate historical analysis. Agricultural commodities show harvest-related fluctuations, while construction materials face weather-dependent demand cycles. The Bureau of Labor Statistics publishes both seasonally adjusted and unadjusted data, each serving different analytical purposes.
When studying historical market reactions, determining which version contemporary observers used matters significantly. Before widespread computer availability, seasonal adjustment was less sophisticated, potentially causing market participants to overreact to predictable seasonal movements. Understanding these nuances helps explain historical price volatility that modern analysts might find puzzling.
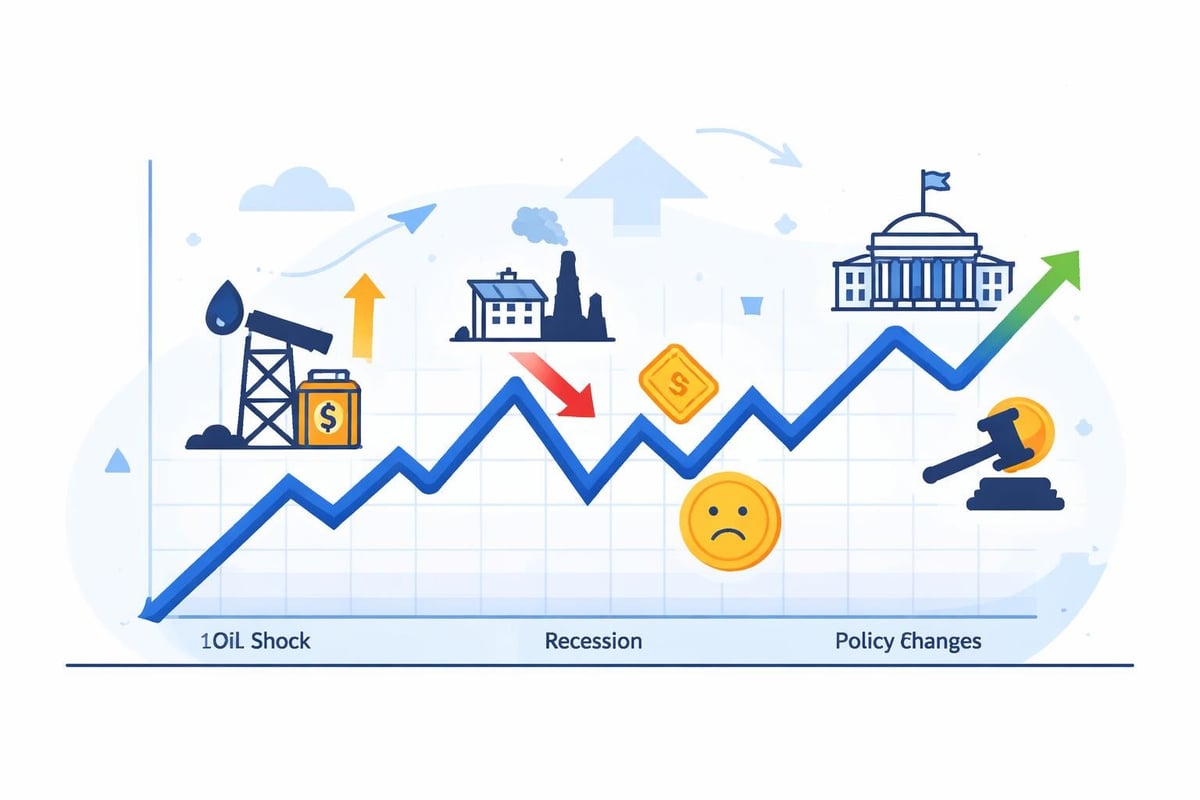
Historical Price Patterns and Economic Cycles
Examining producer price index behavior across multiple business cycles reveals consistent patterns that inform economic forecasting. The index typically accelerates during economic expansions as demand strengthens and capacity constraints emerge. Conversely, recessions generally bring producer price deceleration or outright deflation as demand collapses and producers compete for limited orders.
The historical PPI data from Statista illustrates these cyclical swings clearly from 1990 through 2023. The early 1990s recession showed moderate price declines, while the 2001 tech recession produced more mixed results given the manufacturing versus services divide.
Notable historical episodes include:
- 1973-1975 Oil Crisis: Producer prices surged 18.9% in 1974 as energy costs exploded
- 1980-1982 Volcker Disinflation: Aggressive monetary tightening brought producer inflation from 11.8% to negative territory
- 2008-2009 Financial Crisis: Producer prices fell 5.4% in 2009, the sharpest decline since measurement began
- 2021-2022 Pandemic Recovery: Producer inflation reached 9.7%, the highest since methodology changes
These episodes demonstrate how the producer price index responds to supply shocks, monetary policy shifts, and demand collapses differently than consumer price measures. The recent AP News reporting on PPI data shows how contemporary analysts interpret these movements in real-time.
Commodity Price Volatility
Raw material components exhibit far greater volatility than finished goods categories. Energy and agricultural products can swing dramatically within months, driven by geopolitical events, weather patterns, and speculation. Historical analysis reveals that these volatile inputs often signal broader inflationary trends six to twelve months before they appear in consumer prices.
During the 1970s stagflation period, commodity-driven producer price spikes preceded consumer inflation peaks consistently. This pattern repeated during the 2007-2008 commodity boom, when crude material prices surged over 30% before broader inflation accelerated. Investors studying these historical precedents gained valuable timing advantages for inflation-sensitive positions.
Relationship with Other Economic Indicators
The producer price index interacts with numerous other economic measurements, creating an interconnected web of data that historians and analysts must navigate. Understanding these relationships helps explain market movements and policy decisions across different eras. Similar to how EBIT measures operational profitability, the producer price index measures operational cost pressures.
| Indicator | Relationship | Historical Lead/Lag |
|---|---|---|
| Consumer Price Index | PPI typically leads by 2-6 months | Strong positive correlation |
| Federal Funds Rate | Central banks respond to PPI acceleration | Policy follows with 3-12 month lag |
| Profit Margins | Rising PPI without pricing power compresses margins | Contemporaneous relationship |
| Stock Market | Mixed relationship depending on context | Varies by sector and cycle stage |
The Federal Reserve has historically monitored producer price trends closely when calibrating monetary policy. During the 1990s expansion, Fed Chairman Alan Greenspan often cited stable producer prices as evidence that growth could continue without triggering inflation. This relationship between the producer price index and policy rates influenced investment strategies throughout that era.
Impact on Corporate Earnings
Production cost changes directly affect corporate profitability, but the relationship varies by industry and competitive dynamics. Companies with strong pricing power can pass cost increases to customers, protecting margins. Firms in competitive markets often absorb producer price increases, suffering margin compression.
Historical analysis reveals that the producer price index accelerations in 1973-1974, 1978-1980, and 2021-2022 all coincided with significant margin pressure for manufacturers and retailers. Companies that failed to adapt pricing strategies or hedge commodity exposure underperformed during these periods. Studying these episodes provides valuable lessons for understanding how cost inflation flows through to financial statements and ultimately cash flow statements.
Sector-Specific Analysis Opportunities
Breaking down the producer price index by industry reveals divergent trends that aggregate numbers obscure. Service sector prices often follow different patterns than goods-producing industries, while within goods production, durables and nondurables exhibit distinct behaviors. For historical market analysts, these granular details explain sector rotation patterns and relative stock performance.
The technology sector provides a fascinating case study where producer prices have declined consistently over decades due to productivity improvements and Moore's Law effects. Computer and electronic product prices in the producer price index have fallen approximately 90% since the mid-1990s when adjusted for quality improvements. This deflationary force offset inflationary pressures elsewhere in the economy.
Key sector patterns include:
- Energy extraction shows extreme volatility correlated with crude oil markets
- Food manufacturing tracks agricultural commodity cycles with seasonal overlays
- Construction materials exhibit strong cyclical sensitivity to housing markets
- Healthcare services demonstrate steady, above-average price growth since the 1980s
Understanding these sector-specific dynamics helps explain why broad market indices sometimes diverge from inflation expectations. When the producer price index rises primarily due to energy or food, technology and service stocks may remain unaffected or benefit from relative stability.
International Comparisons
While the U.S. producer price index receives the most attention from American investors, comparing it to equivalent measures in other economies reveals important global trends. The Wikipedia overview of producer price indices shows how different countries calculate similar metrics with varying methodologies.
European countries experienced different producer price trajectories during the 2010s eurozone crisis, with peripheral nations facing deflation while core economies maintained modest inflation. These divergences explained currency movements and sovereign debt spreads that dominated market narratives during that period. Investors who understood these producer price differentials gained insights into relative economic performance and central bank policy divergence.

Using Historical PPI Data for Investment Analysis
Incorporating producer price index history into investment analysis requires understanding both the indicator's predictive power and its limitations. While producer prices often lead consumer inflation, the relationship varies depending on economic context and which components drive the changes. Moody's Analytics PPI data provides comprehensive historical series that enable rigorous backtesting of investment strategies.
Investors have successfully employed several approaches based on historical producer price patterns:
- Inflation hedging: Accelerating PPI signals increasing allocation to inflation-protected securities and commodities
- Sector rotation: Rising input costs favor companies with pricing power over margin-sensitive competitors
- Fixed income positioning: Producer price trends help anticipate Federal Reserve policy shifts affecting bond markets
- Currency trading: Relative PPI changes across countries influence exchange rate expectations
Backtesting these strategies across multiple decades reveals that simple rules rarely work consistently. The 1990s productivity boom broke traditional relationships between producer prices and inflation outcomes. The 2008 financial crisis demonstrated that demand collapse could override cost-push inflation concerns instantly.
Case Study: 2006-2008 Commodity Supercycle
Between 2006 and mid-2008, the producer price index for crude materials surged over 60%, driven by booming global demand and supply constraints. Many investors interpreted this as signaling persistent inflation that would force aggressive Federal Reserve tightening. In reality, the financial crisis intervened, causing producer prices to crash over 20% in six months.
This episode illustrates the danger of mechanical reliance on producer price index trends without considering broader financial stability risks. Investors who recognized credit market stress as the dominant factor avoided significant losses from overly aggressive inflation hedges. Historical study of such episodes trains judgment about when traditional indicator relationships might break down. Understanding concepts like marginal cost helps investors interpret how producer price changes affect business decisions.
Interpreting Recent Historical Trends
The 2020-2022 period created unprecedented producer price volatility that will occupy economic historians for decades. Pandemic-related supply chain disruptions, fiscal stimulus, monetary accommodation, and recovery demand combined to produce the sharpest producer price acceleration since the 1970s. Peak year-over-year producer price index growth exceeded 11% in 2021, levels not seen in over forty years.
Several unique factors distinguished this episode:
- Supply chain disruptions affected intermediate goods more severely than prior cycles
- Services inflation accelerated alongside goods inflation, a rare combination
- Labor market tightness contributed to cost pressures across all sectors
- Energy price volatility amplified swings in overall indices
These conditions tested traditional inflation models and forced analysts to revisit historical precedents more carefully. While superficial comparisons to 1970s stagflation gained traction, important differences emerged upon closer examination. The 2020s shock originated from both supply and demand simultaneously, whereas 1970s inflation stemmed primarily from supply constraints and monetary policy errors.
The subsequent 2023-2024 producer price deceleration as supply chains normalized demonstrated how temporary shocks can reverse relatively quickly when underlying conditions change. This pattern more closely resembled post-Korean War adjustments in the early 1950s than the persistent 1970s inflation. Investors who recognized these historical parallels positioned portfolios more effectively than those anchored to misleading analogies.
Learning from Historical Forecast Errors
Studying how economists and market participants misinterpreted producer price trends historically provides valuable lessons. The 1990s featured repeated warnings of imminent inflation based on producer price upticks that never materialized into consumer inflation. Productivity gains and globalization broke traditional transmission mechanisms.
Conversely, the mid-2000s saw many analysts dismiss rising producer prices as reflecting transitory commodity speculation rather than genuine demand pressures. While the financial crisis ultimately validated skepticism about sustained inflation, the initial dismissal of cost pressures proved premature for 2006-2007 investment decisions. These historical examples underscore the difficulty of real-time interpretation versus retrospective analysis with complete information.
Understanding the producer price index through historical context transforms it from a simple inflation gauge into a rich source of economic insight. By examining how this measure has evolved, responded to shocks, and related to other indicators across different eras, investors and analysts develop deeper intuition about current market conditions. The patterns revealed through decades of data help identify when contemporary situations truly resemble past episodes versus when superficial similarities mask important differences. Historic Financial News provides the interactive tools and contextual analysis to explore these patterns across market history, helping you connect past producer price trends to future investment opportunities through comprehensive historical data and AI-powered insights.