
Payback Period Guide: Master the Basics for 2025
Curious how long it takes for your investment to pay for itself? The payback period is your starting point. In today’s fast-moving financial world, making quick, data-driven decisions is more important than ever for 2025.
This guide breaks down the payback period, removing confusion so you can use this essential metric confidently. You’ll learn what it is, why it matters, how to calculate it, see real-world examples, weigh its pros and cons, and compare it with other key financial tools.
Ready to make smarter investment decisions? Let’s master the basics together.
What Is the Payback Period?
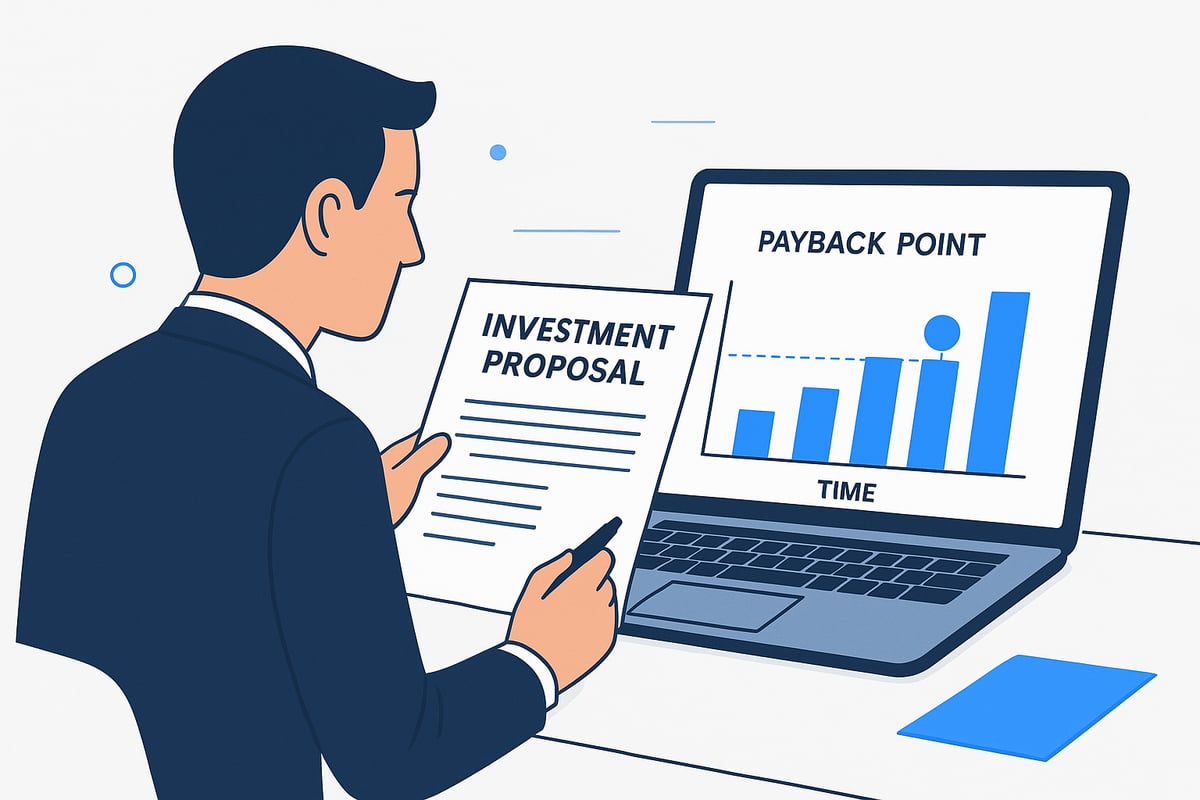
Understanding the payback period is essential for anyone making investment decisions. At its core, the payback period measures how long it takes for an investment to generate enough cash flows to recover its initial outlay. This straightforward metric has become a staple in financial analysis because it answers a simple, yet critical, question: When will you get your money back?
The payback period first gained traction in the early 20th century, as businesses and project managers sought a clear way to evaluate investment risk. Its popularity grew with the rise of capital budgeting, as companies needed a fast, reliable method to compare projects. Over time, the payback period became a go-to tool for both corporate finance teams and individual investors, valued for its ease of use and intuitive insight.
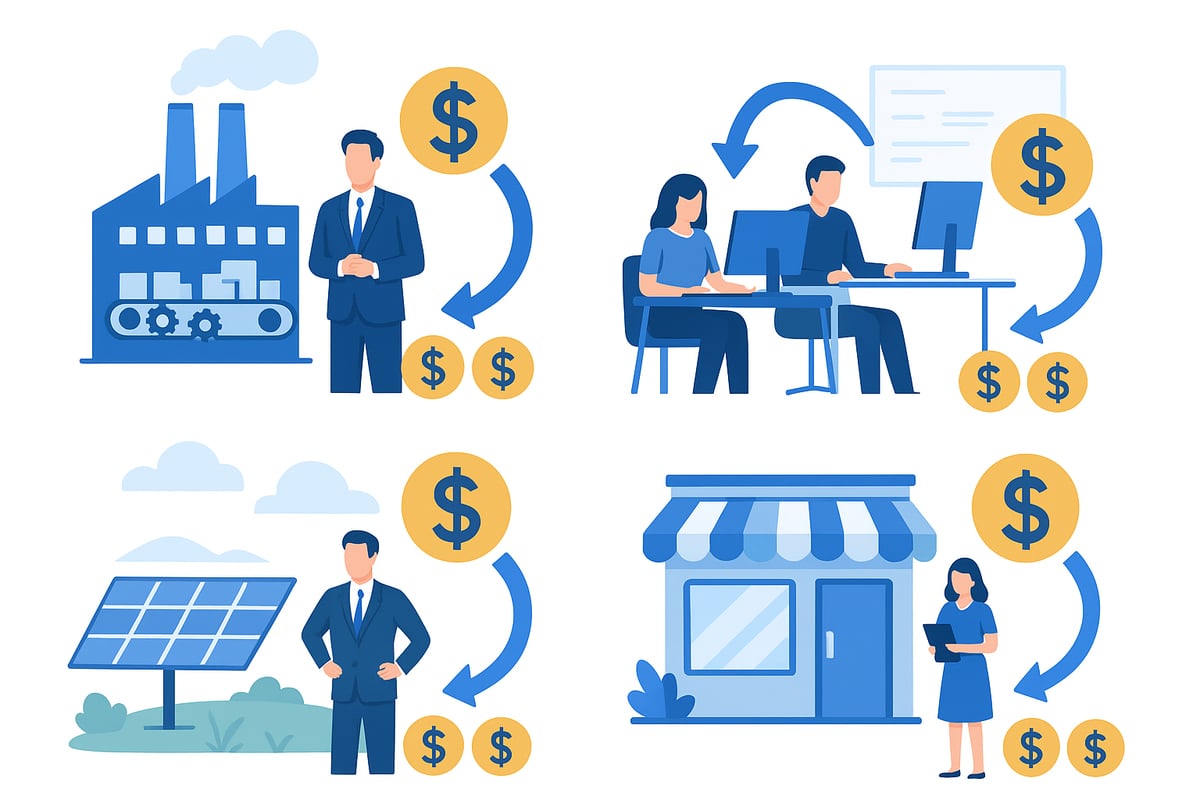
Today, the payback period is widely used across various financial decisions. Companies turn to this metric for capital budgeting, project selection, and risk assessment. In personal finance, individuals use it to evaluate purchases such as home improvements or solar panel installations. The payback period is also a key consideration in industries like real estate, energy, and manufacturing, where investment timing and cash flow recovery are crucial.
To accurately determine the payback period, you need to consider three main components:
| Key Component | Description |
|---|---|
| Initial Investment | The upfront cost required for the project |
| Annual Cash Inflows | The expected periodic returns or savings |
| Calculation Period | The timeframe over which cash flows are tracked |
With these elements, you can apply the payback period formula to analyze any investment opportunity.
There are two main ways to calculate the payback period: the simple method and the discounted method. The simple payback period assumes all cash inflows have equal value, while the discounted payback period accounts for the time value of money by adjusting future cash flows. Understanding the difference is important, especially when inflation or interest rates are high.
Here is a quick look at both approaches:
Simple Payback Period = Initial Investment / Annual Cash Inflow

Discounted Payback Period = Years until Cumulative Discounted Cash Flows = Initial Investment
For a practical example, imagine a company considering a $100,000 investment in new equipment. If the equipment is expected to generate $25,000 in annual savings, the simple payback period would be four years. However, if some years yield higher or lower savings, or if you apply a discount rate, the calculation becomes more nuanced. For a step-by-step walkthrough, you can refer to this Payback Period Calculation Guide.
In 2025, the payback period remains as relevant as ever. Businesses, startups, and investors face uncertain markets and tighter budgets, making quick, data-driven decisions essential. According to Wall Street Prep, the payback period continues to stand alongside net present value (NPV) and internal rate of return (IRR) as a core capital budgeting metric. Its simplicity and clarity ensure it will remain a staple in financial analysis for years to come.
Why the Payback Period Matters in Modern Finance
In the fast-paced world of modern finance, the ability to evaluate investments swiftly is more critical than ever. The payback period offers a direct path for investors and managers to assess how quickly they can recover their capital. As organizations strive for agility in 2025, mastering the payback period can provide a strategic edge.
Quick Decision-Making with Payback Period
Speed is essential in today's investment landscape. The payback period allows decision-makers to rapidly screen potential projects, identifying those that promise faster capital recovery. This is particularly valuable for businesses operating in volatile markets or under tight budget constraints.
By calculating the payback period, teams can quickly eliminate options that do not meet minimum requirements. For example, if a company's policy is a three-year payback period, any project exceeding this timeline can be deprioritized early. According to CFI, the payback period is often the first filter before more complex analyses are performed.
This ability to act promptly on investment opportunities can mean the difference between seizing a competitive advantage and missing out.
Managing Risk and Embracing Simplicity
Risk management is at the heart of every financial decision. The payback period helps minimize risk by favoring projects that return capital sooner, thereby reducing exposure to market shifts and economic uncertainty. Shorter payback periods are especially attractive in sectors where technological change or policy shifts can quickly alter business fundamentals.
Another advantage of the payback period is its simplicity. Unlike metrics that require advanced calculations, the payback period can be understood and applied by a wide range of stakeholders. Managers, investors, and even non-financial professionals can easily grasp the concept. This ease of use makes it a powerful communication tool when justifying project choices to boards or investors.
For those seeking a deeper understanding of how the payback period fits into the broader context of financial decision-making, the Financial Decision-Making Lecture Notes offer a comprehensive overview, including practical calculation and interpretation.
Limitations and Industry Use Cases
Despite its strengths, the payback period has notable limitations. It ignores any cash flows that occur after the initial investment is recovered and does not account for the time value of money. This means that two projects with identical payback periods could have very different long-term profitability.
Nevertheless, the payback period remains widely used across industries such as manufacturing, technology startups, real estate, and energy. In manufacturing, it helps prioritize equipment upgrades. Tech firms use it to gauge the viability of software development, while real estate and energy projects rely on it to evaluate capital-intensive investments.
Consider two projects: both require a $100,000 investment. Project A pays back in three years, Project B in five. Even if total returns are similar, the preference often goes to Project A due to lower risk and faster liquidity.
In summary, the payback period continues to be a practical, accessible, and effective tool for initial investment screening, especially when paired with more comprehensive metrics for a full financial picture.
How to Calculate the Payback Period: Step-by-Step Guide
Understanding how to calculate the payback period is essential for anyone making investment decisions in 2025. By following this step-by-step guide, you will be able to confidently assess how quickly your investment can be recouped. Each step is designed to clarify the process, from collecting data to presenting your results.
Step 1: Gather Required Data
The first step in calculating the payback period is gathering all necessary data. Begin by identifying the initial investment amount. This is the upfront cost required to start the project or purchase the asset. Understanding your initial outlay is critical, as it forms the basis for all subsequent calculations.
Next, estimate the annual or periodic cash inflows your investment is expected to generate. These are the net amounts received from the project each year. For some projects, cash inflows may be steady, while others may experience variability due to seasonality or market trends.
Determine the expected lifespan of your project or investment. Knowing how long the asset will generate returns helps frame your analysis. It is also important to note any irregular cash flows, such as one-time bonuses or uneven annual returns, as these will affect your calculation method.
For example, imagine you are considering a $50,000 investment in new machinery. You forecast that it will produce $12,500 in net annual savings. This information enables you to move to the next step.
When gathering this data, remember that the initial investment often falls under capital expenditure. For a deeper understanding of how capital investments factor into your analysis, review the Capital Expenditure in Budgeting guide.
Carefully collecting these details lays the groundwork for an accurate payback period calculation. Missing or misestimating any figures can skew your results and lead to poor investment decisions.
Step 2: Apply the Payback Period Formula
With your data in hand, it is time to apply the payback period formula. For investments with even annual cash inflows, the formula is straightforward:
Payback Period = Initial Investment / Annual Cash Inflow
For example, if your initial investment is $50,000 and your annual cash inflow is $12,500, the payback period is calculated as follows:
Payback Period = $50,000 / $12,500 = 4 years
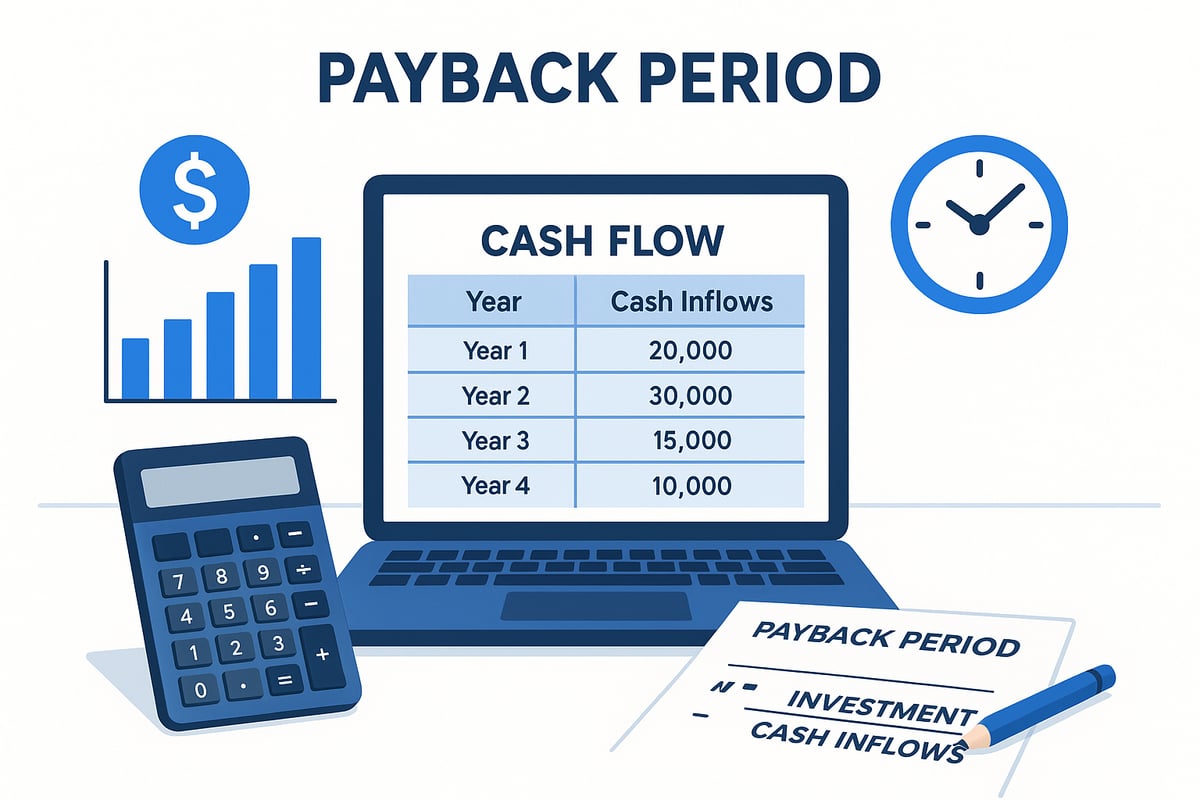
However, many real-world investments feature uneven cash inflows. In these cases, you will need to use cumulative cash flow analysis. Add each year's cash inflow to a running total until the sum equals or exceeds the initial investment. The year in which this occurs marks your payback period.
For instance, if your equipment saves $10,000 in year one, $15,000 in year two, $12,000 in year three, and $13,000 in year four, you would sum the inflows each year until reaching $50,000. This approach ensures you account for irregularities in returns.
Precision in your data entry is crucial here. A single error can significantly impact the calculated payback period, leading to misguided conclusions.
Step 3: Interpret the Results
Once you have calculated the payback period, the next step is to interpret what the result means in practical terms. The payback period tells you how long it will take to recover your initial investment through the project's cash inflows.
Compare the calculated payback period to your organization's benchmarks or policies. For example, if your company requires projects to pay back within three years and your calculation results in four years, the investment may not meet internal criteria.
Consider this scenario: a project has a payback period of four years, but your company's policy is three years. This difference can influence your decision to proceed, modify the project, or seek alternatives.
The payback period also helps you assess risk. A shorter payback period typically indicates a lower risk, as your capital is returned more quickly. Use the result as a guide for further analysis, not as the sole decision-making tool.
Understanding the context of your calculated payback period will help you make informed, strategic choices.
Step 4: Adjust for Discounted Payback Period
In today’s financial environment, it is important to account for the time value of money. The standard payback period calculation does not consider the fact that money received in the future is worth less than money received today. To address this, use the discounted payback period.
Start by applying a discount rate, such as 8 percent, to each year’s projected cash inflow. The formula is:
Discounted Payback Period = Number of years until cumulative discounted cash flows equal initial investment
For example, with an initial investment of $50,000 and a discount rate of 8 percent, discount each year’s inflow before adding it to the cumulative total. Continue until the sum of discounted inflows equals or exceeds the initial investment.
This adjustment is particularly important in periods of higher inflation or rising interest rates. The discounted payback period provides a more realistic view of how long it truly takes to recover your investment.
By incorporating the time value of money, you ensure your analysis reflects actual economic conditions, making your conclusions more robust.
Step 5: Document and Communicate Findings
The final step in payback period analysis is documenting and communicating your results. Best practices include creating clear, concise reports that summarize your calculations and key findings.
Use tables, charts, or graphs to visually present your payback period results. For example, a summary table can compare multiple projects side by side:
| Project Name | Initial Investment | Payback Period | Discounted Payback Period |
|---|---|---|---|
| Equipment Upgrade | $50,000 | 4 years | 4.5 years |
| Software Launch | $30,000 | 2.5 years | 2.8 years |
| Solar Installation | $75,000 | 5 years | 5.6 years |
When presenting your findings to stakeholders, explain your assumptions, highlight key takeaways, and address any limitations in your analysis. Transparency and clarity foster trust and enable confident decision-making.
Remember to include all supporting data, calculations, and rationale. This approach ensures your payback period analysis stands up to scrutiny and serves as a reliable foundation for investment decisions.
Real-World Examples and Case Studies
Curious how the payback period works in actual business scenarios? Real-world examples can bring this metric to life, showing how it guides investment choices across different industries.
Manufacturing Project Example
Imagine a manufacturing company investing $500,000 in an advanced assembly line. The expected annual cash inflow from higher efficiency is $125,000. By dividing the initial investment by the annual cash inflow, the payback period is four years. This straightforward calculation helps managers determine whether the project aligns with their risk tolerance and capital budgeting policies.
Tech Startup Investment
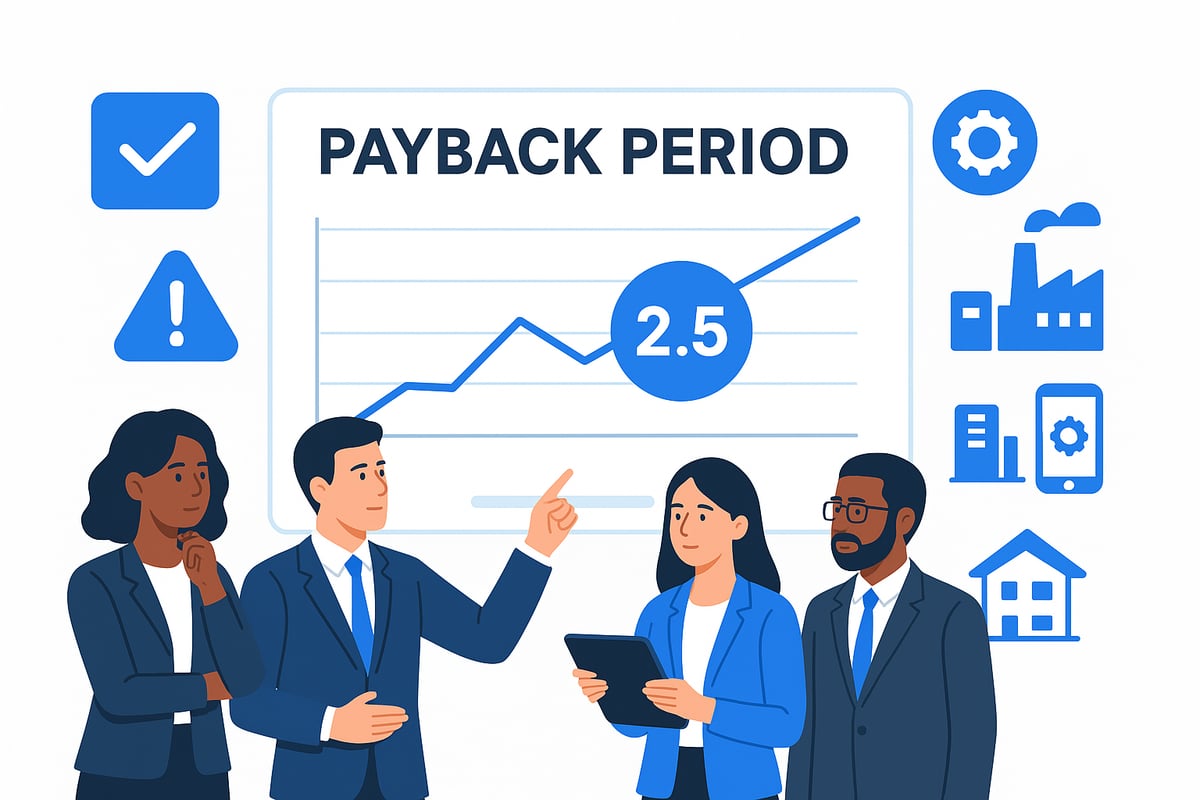
Consider a tech startup allocating $200,000 for the development and launch of a new software product. The anticipated annual net cash inflow is $80,000. Here, the payback period is 2.5 years. For startups, a shorter payback period is especially valuable, as it reduces exposure to market changes and technology shifts, allowing for quicker pivots if necessary.
Renewable Energy: Solar Panel Installation
A small business owner decides to install solar panels, requiring a $60,000 upfront investment. With expected annual energy savings and government incentives totaling $15,000, the simple payback period is four years. However, to account for the time value of money, the owner calculates the discounted payback period using an 8 percent discount rate. This adjustment results in a slightly longer period, reflecting the reduced value of future savings. Both methods help the owner understand when the investment will start generating net positive returns.
Small Business Expansion and Uneven Cash Flows
A retailer is considering opening a new location that requires a $100,000 investment. Projected cash inflows are $30,000 in year one, $40,000 in year two, and $50,000 in year three. By adding the inflows cumulatively, the payback period falls between year two and three. This example highlights the importance of handling uneven cash flows in payback period analysis.
Wall Street Prep provides a similar scenario, where a project with irregular yearly returns requires tracking cumulative cash flows to pinpoint the exact payback period. According to industry data, the average payback period for capital investments in 2024 was 3.2 years, serving as a useful benchmark for comparison.
Lessons from these cases show that the payback period is an essential screening tool across industries. Companies use it to avoid projects with long or uncertain paybacks and to prioritize investments that recover capital quickly. For a deeper dive into how the payback period compares to other metrics like NPV and IRR, the Comparison of Capital Budgeting Methods offers valuable insights.
Payback Period vs. Other Capital Budgeting Metrics
In capital budgeting, the payback period is just one piece of the puzzle. To make informed investment decisions, it is essential to compare this metric with other widely used tools. Each method offers a unique lens through which to evaluate a project’s value and risk.
Net Present Value (NPV) and Internal Rate of Return (IRR)
Net Present Value (NPV) calculates the total value an investment adds by discounting all future cash flows to their present value. This method factors in the time value of money, offering a comprehensive view of profitability. You can learn more about how NPV works in detail by visiting this Net Present Value Overview.
Internal Rate of Return (IRR) estimates the annualized percentage return generated by a project. Unlike the payback period, both NPV and IRR consider all cash flows throughout the project’s life, not just until the investment is recovered.
| Metric | Considers Time Value? | Includes All Cash Flows? | Output Type |
|---|---|---|---|
| Payback Period | No | No | Years |
| NPV | Yes | Yes | Currency Value |
| IRR | Yes | Yes | Percentage |
The payback period is often used as a quick filter before applying more complex methods like NPV or IRR.
Profitability Index (PI) and Accounting Rate of Return (ARR)
Profitability Index (PI) measures the ratio of the present value of future cash flows to the initial investment. A PI over 1.0 signals a potentially profitable project. This index, like NPV, accounts for the time value of money.
Accounting Rate of Return (ARR) focuses on average accounting profit rather than cash flow. ARR is easy to compute but does not account for the timing of profits. To understand how ARR is calculated and see its relationship to metrics like EBIT, refer to Accounting Rate of Return Explained.
While the payback period is simple, PI and ARR offer additional perspectives on efficiency and profitability.
Practical Example and When to Use Payback Period
Imagine two projects, both with a payback period of three years. However, Project A generates most of its returns early, while Project B’s larger profits come later. If Project A has a higher NPV, it creates more value overall, even though the payback period is identical.
This example underscores why financial analysts use the payback period as a “first filter.” According to CFI and Wall Street Prep, it helps quickly eliminate less attractive projects, but deeper analysis with NPV, IRR, or PI is necessary for final decisions.
In summary, the payback period is valued for its speed and simplicity, but it should be complemented with other metrics to ensure robust capital budgeting. Use it to screen opportunities, then dig deeper for a full financial picture.
Pros, Cons, and Practical Tips for Using the Payback Period
Understanding the payback period is essential for effective investment analysis in 2025. This section explores the main strengths and drawbacks of the payback period, along with actionable tips to maximize its value and avoid common mistakes. By mastering these insights, you will be better equipped to use the payback period as a reliable tool in your financial decision-making process.
Advantages of the Payback Period
The payback period offers several significant advantages that make it a popular choice for both individuals and organizations. First and foremost, the payback period is remarkably simple to calculate and interpret. You do not need advanced financial expertise to apply this metric to real-world scenarios.
Another key advantage is speed. The payback period enables quick assessments of whether an investment will recover its cost within an acceptable timeframe. This is especially valuable in fast-paced environments, where decisions must often be made with limited information.
The payback period also helps reduce risk by identifying projects that return capital quickly. For businesses facing market uncertainty, a shorter payback period can mean less exposure to unforeseen changes. Additionally, this metric is easy to communicate to stakeholders who may not have a financial background.
In fact, over 70% of CFOs report using the payback period as a first filter in project evaluations, underscoring its widespread acceptance in the business community.
| Advantages | Description |
|---|---|
| Simplicity | Easy to calculate and understand |
| Speed | Facilitates fast decision-making |
| Risk Reduction | Highlights projects that recover costs quickly |
| Accessibility | Communicates easily to various stakeholders |
Disadvantages and Limitations
Despite its strengths, the payback period is not without its limitations. One of the most notable drawbacks is that the payback period ignores all cash flows that occur after the initial investment is recovered. As a result, it may overlook the long-term profitability of a project.
Another major limitation is that the payback period does not account for the time value of money. In other words, it treats all cash flows as if they have the same value, regardless of when they are received. This can be misleading, especially in environments where inflation or interest rates are high.
Additionally, relying solely on the payback period can lead to poor investment choices if other important factors are neglected. For instance, a project with a short payback period but limited long-term returns may not be the best option for sustained growth.
Finally, accurate cash flow estimation is crucial. Overestimating or underestimating cash inflows can distort the payback period calculation, leading to flawed decisions. Understanding concepts like marginal cost can help improve the accuracy of these estimates.
Practical Tips and Best Practices
To make the most of the payback period, consider these practical strategies:
- Always use the payback period as part of a broader financial toolkit, rather than as your sole decision-making metric.
- Combine the payback period with other capital budgeting methods, such as NPV or IRR, for a more comprehensive analysis.
- Present your payback period findings with clear visuals, including tables and charts, to enhance transparency and stakeholder understanding.
- Regularly update your cash flow projections to reflect changing market conditions.
- Be mindful of common pitfalls, such as ignoring post-payback profitability or failing to adjust for the time value of money.
For example, imagine a project with a payback period of just two years but with minimal profits afterward. While the quick recovery may seem attractive, a deeper analysis using NPV could reveal that the project does not create real value over time.
For those interested in a deeper theoretical perspective on how the payback period fits within broader profitability analysis, the Unified View of Profitability Metrics research paper provides valuable context.
When to Use the Payback Period
The payback period is most useful in situations where risk reduction and liquidity are top priorities. It excels in industries facing rapid technological change, volatile markets, or where capital must be recovered quickly to maintain flexibility.
Startups and small businesses often rely on the payback period to screen projects when resources are limited and quick returns are essential. In sectors like manufacturing, real estate, or energy, the payback period can help prioritize investments that align with risk tolerance and cash flow needs.
However, always remember that the payback period should guide initial screening, not replace deeper financial analysis. By understanding its strengths and weaknesses, you can apply the payback period to make smarter, more resilient investment choices in 2025.
As you now understand, mastering the payback period is about more than just crunching numbers—it's about seeing the bigger picture and making more informed investment decisions. By putting historical market context at your fingertips, you can spot patterns, avoid common pitfalls, and plan for a smarter financial future. If you’re curious about how historical insights can shape the way you analyze investments in 2025, I invite you to Join Our Beta and see firsthand how our platform brings financial history to life. Your journey to more confident investing starts here.