
Money Supply: A Historical Perspective on Economic Drivers
Understanding the mechanisms that drive economic cycles requires examining one of the most fundamental yet frequently misunderstood concepts in finance: the total amount of currency and liquid assets circulating within an economy. The money supply represents the lifeblood of modern financial systems, influencing everything from inflation rates to employment levels. By studying historical patterns in monetary aggregates, investors and analysts can identify recurring themes that continue to shape market outcomes today. This exploration reveals how central banks, commercial institutions, and government policies collectively determine the availability of funds that fuel economic activity across nations.
The Foundation of Monetary Aggregates
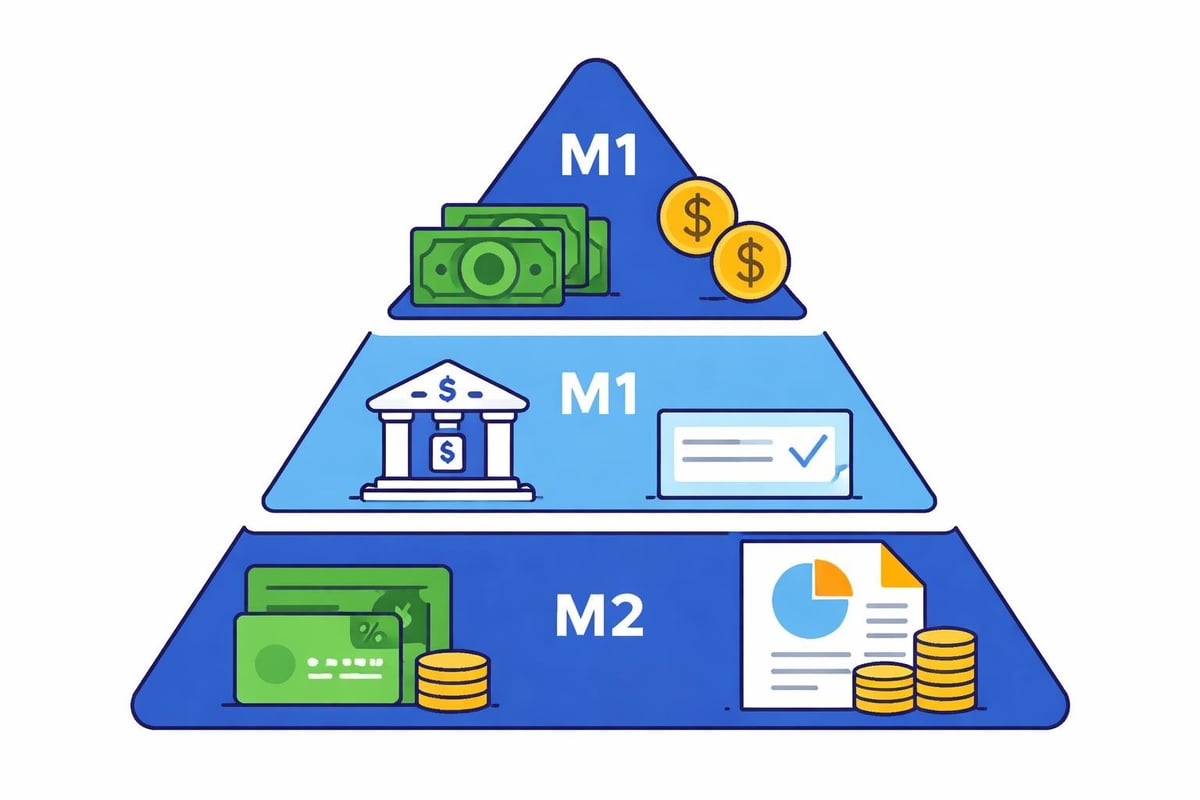
The money supply encompasses all currency held by the public, demand deposits, and other liquid assets that individuals and businesses can readily spend. Economists categorize these assets into distinct classifications based on their liquidity and accessibility.
M1 represents the most liquid forms of money, including:
- Physical currency in circulation
- Demand deposits and checking accounts
- Traveler's checks
- Other checkable deposits
M2 builds upon M1 by adding less liquid but still accessible assets:
- Savings accounts
- Money market mutual funds
- Time deposits under $100,000
- Other near-money assets
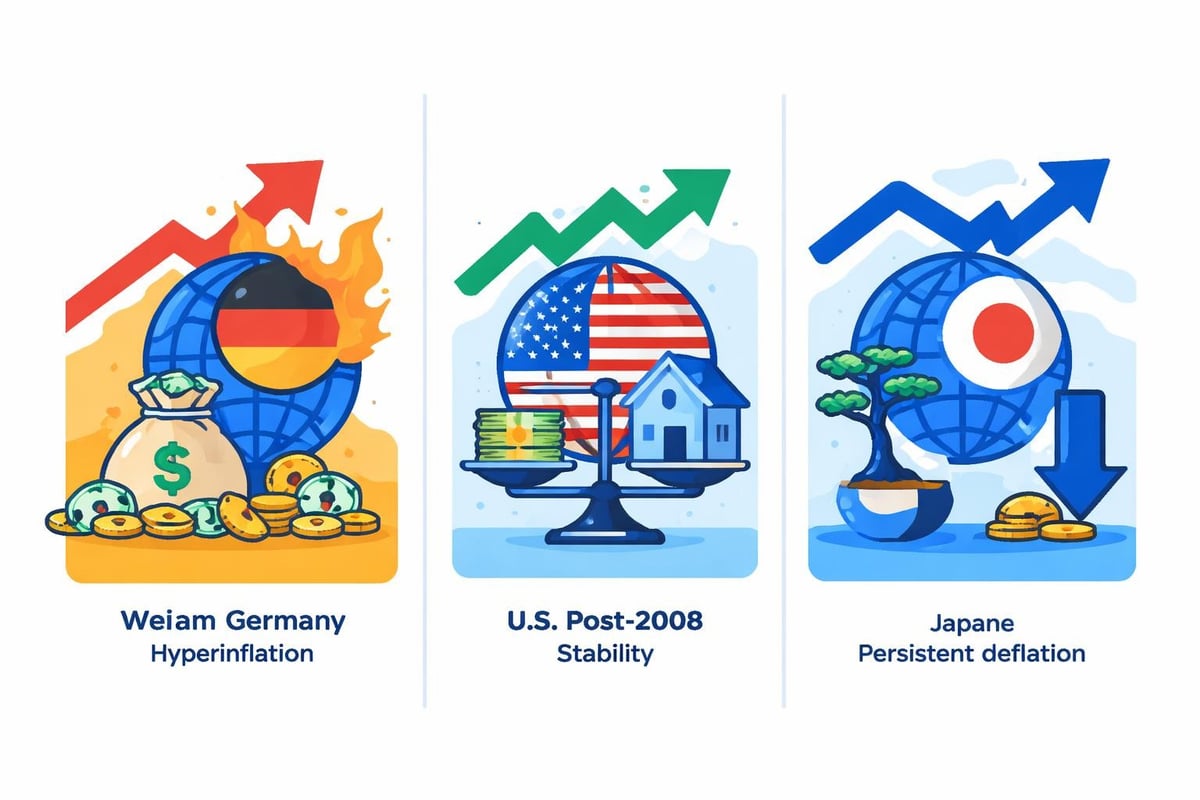
The relationship between money supply measures and inflation has captivated economists for generations. When examining historical data, patterns emerge showing how rapid expansion often precedes price increases, while contraction can trigger deflationary pressures.
Historical Classification Evolution
Money supply measurement has evolved significantly since the early twentieth century. During the 1920s, economists primarily focused on currency and bank deposits without the sophisticated categorization used today. The Federal Reserve formally adopted the M1 and M2 classifications in the 1960s, though the definitions have undergone multiple revisions.
The 1980s brought substantial changes as financial innovation blurred traditional boundaries. Money market accounts, introduced in the early 1980s, created new questions about where certain assets belonged in the classification system. These definitional challenges continue today with digital currencies and new payment technologies reshaping what constitutes readily available funds.
Central Bank Influence Through History
Central banks wield enormous power over monetary conditions through several mechanisms. The Federal Reserve and its international counterparts adjust the money supply primarily through open market operations, reserve requirements, and discount rate changes.
| Mechanism | Direct Effect | Historical Example |
|---|---|---|
| Open Market Operations | Buying/selling government securities | Fed's 2008-2014 quantitative easing |
| Reserve Requirements | Changing bank lending capacity | 1937 reserve requirement doubling |
| Discount Rate | Influencing borrowing costs | Volcker's 1981 rate increases |
The process of money creation extends beyond simple printing of currency. Commercial banks multiply the monetary base through fractional reserve lending, where deposits become loans that create new deposits elsewhere in the system. This multiplier effect means that central bank actions ripple through the entire financial system.
During the Great Depression, the Federal Reserve allowed the money supply to contract by approximately one-third between 1929 and 1933. This catastrophic shrinkage, documented extensively in A Monetary History of the United States by Milton Friedman and Anna Schwartz, transformed economic thinking about central bank responsibilities. The analysis demonstrated how passive monetary policy could amplify economic downturns rather than cushion their impact.
Quantitative Easing and Unconventional Tools
The 2008 financial crisis introduced quantitative easing (QE) as a prominent tool when traditional interest rate adjustments reached their limits. The Federal Reserve purchased trillions in government bonds and mortgage-backed securities, directly injecting reserves into the banking system. This expansion of the monetary base represented an unprecedented peacetime increase.
Between 2008 and 2014, the Fed's balance sheet grew from approximately $900 billion to over $4.5 trillion. Critics warned of impending hyperinflation, yet inflation remained subdued throughout this period. This outcome challenged conventional wisdom about direct relationships between monetary expansion and price levels.
The Bernanke doctrine emphasized aggressive intervention to prevent deflationary spirals. By flooding the system with liquidity, policymakers sought to avoid repeating the mistakes of the 1930s. Subsequent analysis revealed complex interactions between base money, velocity of circulation, and actual spending that defied simple predictions.
Monetarism and Theoretical Frameworks
Monetarism emerged as a dominant school of economic thought in the mid-twentieth century, emphasizing the primacy of monetary factors in determining economic outcomes. Milton Friedman's famous assertion that "inflation is always and everywhere a monetary phenomenon" captured this perspective's essence.

The quantity theory of money provides the mathematical foundation for monetarist thinking:
MV = PQ
Where:
- M represents money supply
- V represents velocity of money circulation
- P represents price level
- Q represents real output of goods and services
This equation suggests that if velocity remains stable and output grows at a predictable rate, controlling money supply growth directly controls inflation. Historical evidence provides mixed support for this framework. The 1970s showed strong correlations between monetary expansion and inflation, while the 2010s demonstrated how velocity collapse could offset base money increases.
Velocity Fluctuations and Real-World Complexity
Money velocity-the rate at which currency circulates through the economy-has proven far less stable than early monetarists assumed. During the 2008 crisis and subsequent recovery, velocity plummeted as banks held excess reserves rather than lending aggressively. This behavioral shift meant that doubling the monetary base did not double spending or prices.
The FDIC plays a crucial role in maintaining confidence that supports normal velocity levels. When depositors trust that their funds remain safe, money circulates more freely. During banking panics, conversely, people hoard currency and velocity collapses.
Historical Case Studies in Monetary Policy
Examining specific episodes reveals how money supply changes influenced market outcomes across different contexts. These cases provide valuable lessons for understanding contemporary monetary dynamics.
The Volcker Disinflation (1979-1982)
Paul Volcker's appointment as Federal Reserve Chairman in 1979 marked a turning point in U.S. monetary history. Facing double-digit inflation, Volcker implemented strict monetary targets that deliberately restricted money supply growth. The Fed funds rate reached 20 percent by mid-1981, triggering a severe recession but ultimately breaking inflationary expectations.
This episode demonstrated that:
- Credible commitment to price stability requires tolerating short-term economic pain
- Expectations matter as much as actual money supply levels
- Financial markets respond dramatically to monetary regime changes
- The relationship between interest rates and money supply can become inverted during transitions
Japan's Lost Decades (1990-2010)
Japan's experience following its 1980s asset bubble collapse illustrated the limits of monetary expansion in a deflationary environment. Despite aggressive efforts to expand the money supply through near-zero interest rates and quantitative easing programs beginning in 2001, Japan struggled with persistent deflation and stagnant growth.
| Period | Policy Action | Money Supply Growth | Result |
|---|---|---|---|
| 1990-1995 | Gradual rate cuts | Moderate | Continued deflation |
| 1995-2001 | Zero interest rate policy | Accelerating | Weak recovery |
| 2001-2006 | First QE program | Rapid expansion | Modest improvement |
The Japanese case revealed that expanding the monetary base alone cannot guarantee economic growth if banks refuse to lend and businesses avoid borrowing. Structural factors, demographics, and psychology create conditions where conventional monetary transmission mechanisms break down.
The Eurozone Crisis (2010-2015)
The European Central Bank faced unique challenges in managing money supply across multiple sovereign nations sharing a single currency. When peripheral countries like Greece, Spain, and Italy faced debt crises, the ECB initially hesitated to expand the money supply aggressively due to German concerns about inflation.
This hesitation prolonged the crisis until ECB President Mario Draghi's 2012 pledge to do "whatever it takes" signaled commitment to unlimited intervention if needed. The subsequent expansion of the money supply through the ECB's balance sheet helped stabilize markets and reduce borrowing costs for struggling nations.
Measuring and Tracking Monetary Aggregates
Modern analysts have access to comprehensive money supply data that enables detailed historical comparisons. However, interpreting this data requires understanding measurement complexities and definitional changes over time.
The Center for Financial Stability publishes Divisia monetary aggregates, which weight different components based on their liquidity characteristics rather than treating all elements equally. This methodology provides more nuanced insights into actual monetary conditions.
Key data sources for historical analysis include:
- Federal Reserve economic data (FRED) database
- International Monetary Fund financial statistics
- Central bank statistical releases
- Academic research datasets
- Commercial financial data providers
Understanding basis points becomes essential when tracking small changes in growth rates that can signal important shifts. A 25 basis point change in money supply growth rates might seem minor but can indicate significant policy adjustments.
Contemporary Challenges and Digital Evolution
The money supply concept faces new definitional challenges as digital currencies and alternative payment systems proliferate. Cryptocurrencies operate outside traditional banking systems, creating parallel monetary ecosystems that central banks cannot directly control.
Central bank digital currencies (CBDCs) represent official responses to these innovations. By 2026, numerous countries have either launched or are piloting digital versions of their national currencies. These developments blur traditional boundaries between physical currency, bank deposits, and electronic money.
The velocity question has gained renewed attention as payment technologies accelerate transaction speeds. Real-time payment systems allow money to circulate more rapidly, potentially increasing velocity and complicating money supply management. Central banks must account for these technological factors when calibrating policy.
Shadow Banking and Broad Money Measures
Beyond official M1 and M2 measures, shadow banking creates additional liquidity through repurchase agreements, money market funds, and other instruments. These activities expand effective money supply without appearing in traditional measures, creating blind spots for policymakers.
The 2008 crisis revealed how shadow banking could amplify monetary shocks. When repo markets froze, effective money supply contracted sharply despite official measures showing more modest changes. This disconnect highlighted the need for broader monetary metrics that capture the full spectrum of liquidity sources.
Asset-backed securities played a central role in shadow banking expansion. These instruments converted illiquid assets into tradable securities, effectively creating money-like instruments outside traditional banking channels.
Inflation Dynamics and Money Supply Relationships
The connection between money supply and inflation remains one of finance's most debated topics. Research on inflation dynamics suggests that the relationship depends heavily on context, including output gaps, expectations, and global economic integration.
Historical evidence shows that extreme money supply expansions typically produce inflation, while moderate changes yield ambiguous results. The threshold where monetary growth translates into price increases varies across countries and time periods.
Factors influencing the money-inflation relationship:
- Output capacity: Economies operating below potential can absorb monetary expansion without immediate price pressures
- Expectations: If people believe price increases are temporary, they may not adjust behavior in ways that perpetuate inflation
- Global integration: International trade allows excess money to flow abroad rather than only pushing up domestic prices
- Financial system health: Damaged banking systems may not transmit monetary expansion effectively
The Efficient Market Hypothesis suggests that markets should quickly incorporate money supply information into prices. However, historical episodes show that markets often react with lags or overshoot equilibrium values based on monetary signals.
During the 1970s stagflation, rising money supply coincided with both high inflation and weak economic growth, challenging simple models. This period demonstrated that supply shocks, regulatory changes, and structural factors could override purely monetary influences on price levels.
Money Supply and Financial Market Performance
Equity markets, bond yields, and currency values all respond to money supply changes, though the transmission mechanisms vary. Historically, periods of rapid monetary expansion have often coincided with rising asset prices as abundant liquidity seeks investment opportunities.
The 2010-2020 period exemplified this dynamic. Central bank balance sheet expansions supported equity valuations even as economic growth remained modest. Critics labeled this phenomenon "asset price inflation," distinguishing it from traditional consumer price inflation measured by headline indices.
For investors analyzing historical patterns through platforms like Historic Financial News, understanding monetary conditions provides essential context for market movements. The price-to-earnings ratio often expands during accommodative monetary periods as investors accept higher valuations when alternative investments yield minimal returns.
Credit spreads narrow when money supply expands, as abundant liquidity reduces risk premiums. Conversely, monetary tightening typically widens spreads as investors demand greater compensation for credit risk in a scarcer money environment. These patterns repeat across multiple historical cycles, offering insights for pattern recognition.
Lessons for Modern Market Analysis
Studying historical money supply trends reveals several enduring principles relevant for 2026 market analysis:
Monetary policy operates with long and variable lags. Changes in money supply growth may not affect inflation or output for 12-18 months, making real-time analysis challenging. Historical episodes consistently show this delayed response, from the 1930s deflation to the 2020s inflation surge.
Context matters more than absolute levels. A 10 percent money supply growth rate might be inflationary in some contexts and inadequate in others, depending on output gaps, velocity changes, and expectations. Successful analysis requires comparing current conditions against historical parallels with similar characteristics.
Financial innovation continuously reshapes monetary transmission. Each era develops new financial instruments that alter how money supply changes flow through the economy. From 1920s installment credit to 2020s decentralized finance, innovations require updating analytical frameworks while respecting fundamental relationships.
International linkages constrain individual country policies. In our globally integrated financial system, money supply changes in major economies affect conditions worldwide through exchange rates, capital flows, and trade balances. Historical analysis must account for these cross-border dynamics.
The study of monetary aggregates through historical lenses continues yielding valuable insights for understanding contemporary market dynamics. As research resources on money supply expand, investors gain access to richer datasets spanning longer time periods and covering more countries.
Understanding how money supply has driven historical market events equips investors, students, and analysts with frameworks for interpreting contemporary financial conditions. By recognizing patterns in monetary expansion, contraction, and their varied outcomes across different contexts, market participants can make more informed decisions. Historic Financial News provides the tools to explore these monetary patterns through interactive historical data, helping you connect past policy decisions to their market consequences and apply these lessons to current investment strategies.