
Free Cash Flow: A Historical Analysis Tool
Understanding the financial health of companies across different market periods requires more than just examining revenue or profit margins. One of the most revealing metrics in financial analysis, particularly when studying historical market movements, is the amount of cash a business generates after accounting for the investments needed to maintain and expand operations. This measure provides invaluable insights into corporate resilience during market crises, expansion periods, and economic transitions that have shaped modern finance.
The Fundamental Nature of Free Cash Flow
Free cash flow represents the cash a company generates after accounting for cash outflows to support operations and maintain capital expenditure. Unlike accounting profits, which can be influenced by non-cash items and various accounting methods, this metric focuses on actual cash generation. The calculation of free cash flow provides a clearer picture of a company's ability to generate value for shareholders, fund growth initiatives, pay dividends, or reduce debt.
The importance of this metric becomes particularly evident when examining historical market periods. During the dot-com bubble of the late 1990s, many technology companies reported impressive revenue growth while hemorrhaging cash. Investors who focused on traditional earnings metrics often overlooked the negative cash generation, leading to substantial losses when the bubble burst in 2000-2001.
Historical Context in Market Analysis
Throughout financial history, companies with strong cash generation capabilities have demonstrated greater resilience during economic downturns. The 2008 financial crisis serves as a compelling case study. Firms with robust free cash flow positions could weather the credit freeze, maintain operations, and even acquire distressed competitors at favorable prices.
Key historical periods where free cash flow analysis proved critical:
- The 1987 market crash and subsequent recovery
- The savings and loan crisis of the 1980s and early 1990s
- The Asian financial crisis of 1997-1998
- The dot-com bubble and burst (1995-2002)
- The global financial crisis (2007-2009)
- The European debt crisis (2010-2012)
Companies like Microsoft, Apple, and Johnson & Johnson maintained strong cash positions through multiple market cycles, enabling them to invest during downturns when competitors faced constraints.

Calculation Methods and Variations
The standard approach to calculating this metric begins with operating cash flow from the company's cash flow statement. From this figure, analysts subtract capital expenditures required to maintain and grow the business. This fundamental calculation provides the baseline measure, though several variations exist depending on the specific analytical purpose.
| Calculation Component | Description | Source Document |
|---|---|---|
| Operating Cash Flow | Cash generated from core business operations | Cash Flow Statement |
| Capital Expenditures | Cash spent on property, plant, equipment | Cash Flow Statement |
| Free Cash Flow | Operating Cash Flow minus CapEx | Calculated Metric |
| FCF Margin | Free Cash Flow divided by Revenue | Multiple Statements |
Levered Versus Unlevered Free Cash Flow
Financial analysts distinguish between levered and unlevered versions of this metric. Unlevered free cash flow represents the cash available to all investors (both debt and equity holders) before interest payments. This version proves particularly useful when comparing companies with different capital structures or when conducting valuation analyses.
Levered free cash flow, conversely, accounts for interest payments and represents the cash available specifically to equity shareholders. Understanding this distinction becomes crucial when analyzing historical acquisitions, management buyouts, or leveraged recapitalizations that characterized the 1980s and 2000s.
The free cash flow to equity calculation adjusts for debt-related cash flows, providing a clearer picture of returns available to common shareholders.
Interpreting Free Cash Flow in Historical Context
Positive cash generation indicates a company produces more cash than required for operational maintenance and growth investments. This surplus can fund shareholder returns, debt reduction, or strategic acquisitions. However, the interpretation requires nuanced understanding of industry dynamics and economic conditions.
Growth Companies and Investment Cycles
High-growth companies, particularly in emerging industries, often exhibit negative or minimal free cash flow during expansion phases. Amazon's history provides an instructive example. Throughout the 1990s and 2000s, the company reinvested heavily in infrastructure, distribution centers, and technology, resulting in minimal free cash flow despite growing revenues. Investors who recognized the strategic value of these investments and the company's improving operating margin realized substantial returns.
Factors affecting free cash flow across different market periods:
- Capital intensity of the business model - Manufacturing and infrastructure businesses typically require higher ongoing capital investments than software or service companies
- Industry maturity and competitive dynamics - Emerging industries often demand greater reinvestment than mature sectors
- Economic conditions and interest rate environments - The cost of capital influences investment decisions and cash allocation
- Regulatory changes and compliance requirements - New regulations can necessitate significant capital outlays
- Technological disruption and innovation cycles - Industries facing technological change may require defensive investments
The telecommunications industry illustrates these dynamics well. Following the Telecommunications Act of 1996, companies invested billions in network infrastructure, depressing free cash flow. Those that managed capital allocation wisely emerged as industry leaders, while overleveraged competitors faced bankruptcy during the 2001-2002 downturn.

Free Cash Flow as a Valuation Tool
Financial analysts and investors employ this metric extensively in company valuation, particularly through discounted cash flow (DCF) analysis. This approach projects future cash generation and discounts it to present value, providing an estimate of intrinsic worth. Historical analysis of market valuations reveals periods when market prices diverged significantly from DCF-based valuations.
Historical Valuation Discrepancies
The late 1990s technology bubble created enormous gaps between market valuations and fundamental cash-generating capabilities. Companies with no path to positive cash generation commanded billion-dollar market capitalizations based purely on growth narratives. Understanding how free cash flow analysis could have identified overvaluation provides valuable lessons for contemporary market analysis.
Conversely, the 2008-2009 financial crisis created opportunities where solid businesses with consistent cash generation traded at substantial discounts to intrinsic value. Investors who maintained disciplined valuation frameworks based on cash flow metrics identified exceptional opportunities during the panic.
| Market Period | Average P/FCF Ratio | Notable Characteristics |
|---|---|---|
| Pre-1987 Crash | 12-15x | Moderate valuations, stable growth |
| 1999-2000 Peak | 25-30x+ | Extreme valuations, many negative FCF |
| 2009 Trough | 8-10x | Depression valuations, quality discount |
| 2015-2019 | 18-22x | Elevated but sustainable valuations |
| 2020-2021 | 20-28x | Pandemic-era stimulus and low rates |
Quality of Earnings and Cash Flow Analysis
The relationship between reported earnings and actual cash generation reveals much about earnings quality and management practices. Companies with consistently higher cash flow than reported net income typically employ conservative accounting practices and demonstrate sustainable business models.
Historical analysis reveals numerous instances where divergence between earnings and cash flow signaled problems. Enron's collapse in 2001 provides a stark example. While the company reported growing profits, detailed analysis of cash flow statements would have revealed deteriorating cash generation and increasing reliance on complex financing arrangements.
Working Capital Management Through History
Changes in working capital significantly impact cash generation. Companies that efficiently manage inventory, receivables, and payables convert sales into cash more quickly. Dell's direct-to-consumer model in the 1990s and 2000s demonstrated how superior working capital management could create competitive advantages through negative cash conversion cycles.
Working capital components affecting free cash flow:
- Accounts receivable changes - Slower collections reduce cash flow
- Inventory fluctuations - Building inventory consumes cash
- Accounts payable management - Extended payment terms preserve cash
- Deferred revenue patterns - Prepayments boost cash position
Industry-Specific Considerations
Different industries exhibit distinct cash flow characteristics based on their business models, competitive dynamics, and capital requirements. Understanding these patterns proves essential when conducting historical comparative analysis across sectors.
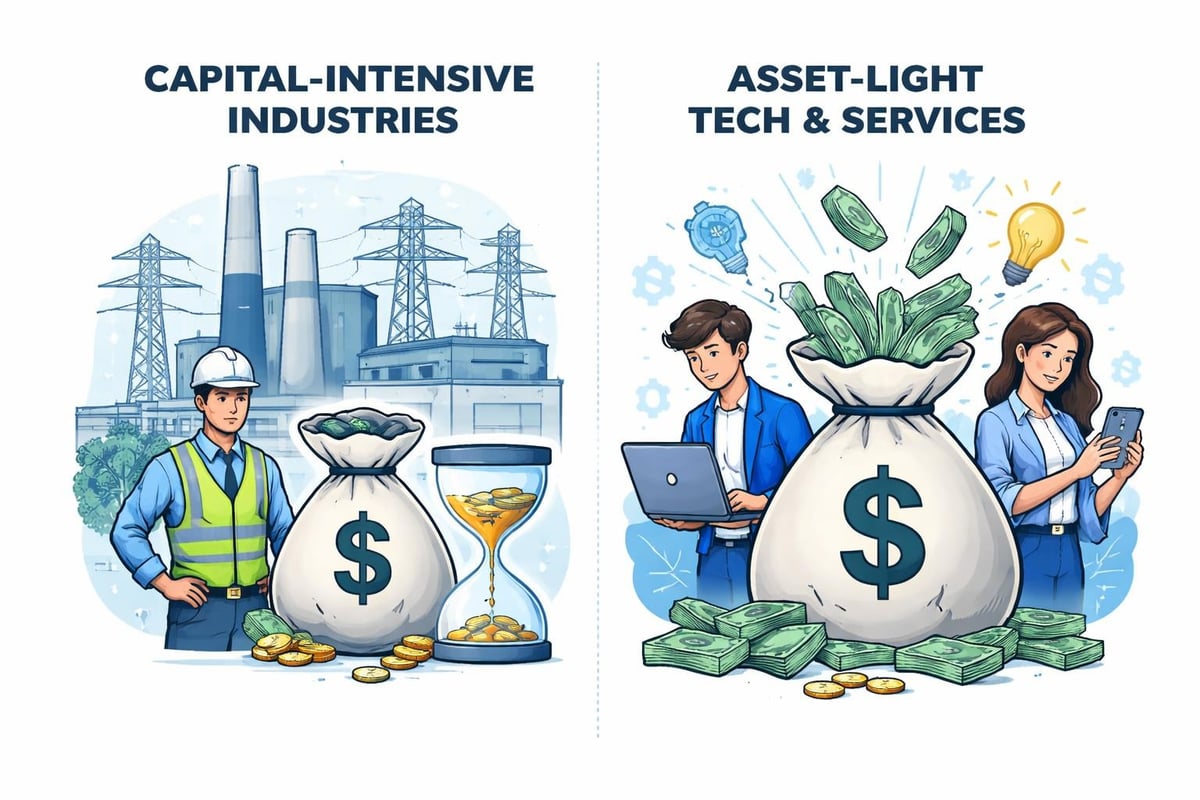
Capital-Intensive Industries
Utilities, telecommunications, and manufacturing businesses require substantial ongoing capital investment to maintain and expand operations. These companies typically generate lower free cash flow margins but often provide stable, predictable cash generation. Historical analysis of utilities throughout the 20th century shows consistent modest cash generation supporting reliable dividend payments.
Asset-Light Business Models
Technology and professional services firms often demonstrate higher free cash flow conversion as they require minimal physical capital investment. Microsoft's evolution from the 1990s through 2026 illustrates how software businesses can achieve exceptional cash generation once development costs stabilize and market positions solidify.
The shift toward software-as-a-service (SaaS) models in the 2010s initially depressed free cash flow for many companies as they transitioned from perpetual licenses to subscription revenue. However, successful transitions ultimately resulted in more predictable, higher-quality cash streams.
Strategic Applications in Investment Analysis
Investors and analysts employ free cash flow metrics in multiple ways beyond basic valuation. Examining how successful investors throughout history utilized this metric provides practical frameworks for contemporary analysis. Warren Buffett's emphasis on "owner earnings" (a concept closely related to free cash flow) guided Berkshire Hathaway's acquisition strategy for decades.
Dividend Sustainability Analysis
Free cash flow analysis reveals whether companies can sustain and grow dividend payments. Historical examination of dividend cuts during recessions shows that companies with insufficient cash generation relative to dividend commitments often face difficult choices during downturns. The 2008-2009 financial crisis saw numerous dividend reductions among companies that had maintained insufficient cash cushions.
The relationship between free cash flow and shareholder distributions provides insights into management priorities and financial discipline. Companies consistently returning 40-60% of free cash flow to shareholders while reinvesting the remainder typically demonstrate balanced capital allocation.
Debt Service Coverage
A company's ability to service debt obligations depends fundamentally on cash generation rather than accounting profits. The leveraged buyout boom of the 1980s and its subsequent difficulties illustrated the dangers of overleveraging relative to cash-generating capacity. Understanding debt coverage ratios in conjunction with free cash flow analysis provides comprehensive credit risk assessment.
Debt service coverage evaluation:
- Compare free cash flow to total debt service requirements (principal plus interest)
- Assess trends in coverage ratios over economic cycles
- Evaluate covenant compliance and financial flexibility
- Consider refinancing risks and maturity schedules
- Analyze cash flow volatility and seasonal patterns
Limitations and Analytical Considerations
While free cash flow provides powerful insights, understanding its limitations prevents misapplication. Capital expenditure classification involves management judgment, creating potential for manipulation. Some companies capitalize expenses that competitors expense immediately, affecting comparability.
Cyclical businesses present particular challenges. Capital equipment manufacturers might generate exceptional free cash flow during boom periods while consuming cash during downturns. Evaluating these companies requires examining full economic cycles rather than snapshot periods.
Historical Accounting Changes
Accounting standards have evolved substantially over recent decades, affecting how companies report cash flows. The shift to standardized cash flow statements in 1987 improved transparency, but earlier historical analysis requires adjustments and approximations. Comparing companies across different accounting regimes demands careful normalization.
The introduction of lease accounting changes in 2019 affected reported operating cash flows for many companies, though the economic reality of their cash generation remained unchanged. Historical analysis must account for such regulatory shifts to maintain consistency.
Practical Application Framework
Developing a systematic approach to free cash flow analysis enhances its utility in investment research and market analysis. A comprehensive framework examines trends over multiple years, compares results to industry peers, and contextualizes findings within broader economic conditions.
| Analysis Component | Time Horizon | Key Questions |
|---|---|---|
| Trend Analysis | 5-10 years | Is FCF growing, stable, or declining? |
| Margin Analysis | Multi-year | How does FCF margin compare to peers? |
| Conversion Ratio | Annual | What percentage of revenue becomes FCF? |
| Reinvestment Rate | Multi-year | How much FCF is reinvested vs. returned? |
| Cycle Position | Full cycle | Where is the company in its investment cycle? |
Integration with Other Metrics
Free cash flow analysis achieves maximum effectiveness when integrated with other financial metrics. Examining the price-to-earnings ratio alongside price-to-free-cash-flow provides multiple valuation perspectives. Similarly, understanding EBIT and its relationship to operating cash flow reveals the impact of working capital and non-cash charges.
Historical case studies demonstrate that companies trading at low multiples of free cash flow with improving operational metrics often outperform over subsequent periods. Conversely, companies with deteriorating cash conversion despite growing revenues frequently disappoint investors.
Understanding free cash flow through a historical lens provides investors, analysts, and students with critical insights into company quality, valuation accuracy, and market cycles. By examining how businesses generated and deployed cash during various economic conditions over the past several decades, you can develop pattern recognition skills that inform contemporary investment decisions. Historic Financial News empowers you to explore these financial patterns through interactive charts and AI-powered analysis of historical market movements, helping you understand how cash flow metrics influenced past market events and what lessons apply to today's investment landscape.