
Expense Ratio: Understanding Investment Costs Over Time
Understanding the true cost of investment vehicles has shaped market outcomes throughout financial history. While investors focus on returns, the fees they pay can dramatically alter their long-term wealth accumulation. Among these costs, the expense ratio stands as one of the most significant yet frequently overlooked factors affecting portfolio performance. By examining how these fees have evolved and impacted investors across different market eras, we gain valuable perspective on making informed investment decisions today. Historical patterns reveal that even seemingly small differences in annual fees can translate into substantial wealth transfers over time, making expense ratio awareness essential for anyone studying market behavior.
The Foundation of Expense Ratios
The expense ratio represents the annual fee that mutual funds, exchange-traded funds, and other pooled investment vehicles charge investors to cover operational costs. This percentage-based fee gets deducted from fund assets automatically, reducing the net return that shareholders receive. Understanding this metric requires examining its components: management fees, administrative expenses, distribution costs, and other operational necessities.
Management fees typically constitute the largest portion of the expense ratio, compensating portfolio managers and research teams for their expertise. Administrative costs cover recordkeeping, customer service, legal compliance, and regulatory filings. Distribution fees, often called 12b-1 fees, pay for marketing and selling fund shares to new investors.
Historical Context of Fund Fees
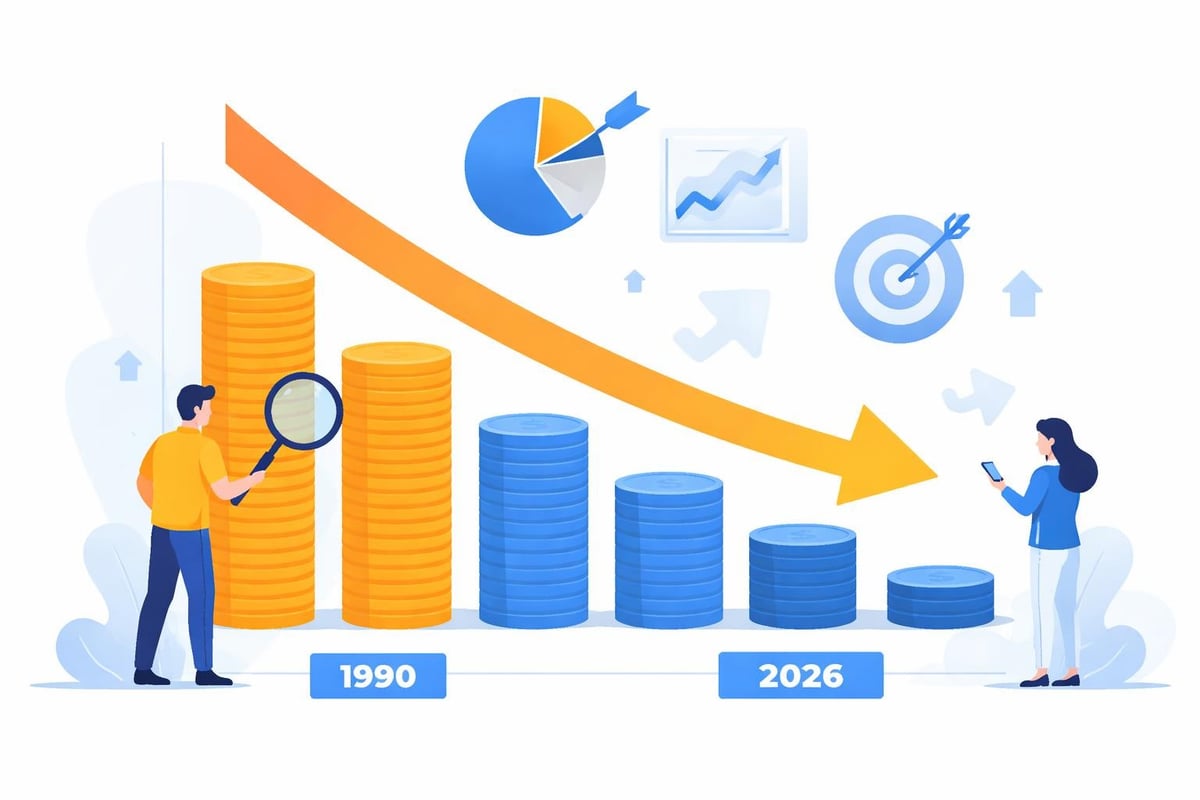
Looking back through financial history, expense ratios have undergone significant transformation. During the 1980s and 1990s, actively managed mutual funds dominated the investment landscape with expense ratios frequently exceeding 1.5% annually. Investors accepted these costs as the price of professional management, often without fully understanding their long-term impact.
The landscape shifted dramatically with the rise of index investing pioneered by Vanguard founder John Bogle. This passive investment approach demonstrated that lower-cost funds could match or exceed the performance of expensive actively managed alternatives. The competitive pressure created by index funds forced the entire industry to reconsider its fee structures, leading to a decades-long trend of declining costs.
Calculating Real Investment Impact
The mathematical reality of expense ratios becomes clear when projected across typical investment horizons. Consider an investor who contributes $10,000 annually for 30 years with an average 7% market return before fees. With a 0.10% expense ratio, the portfolio grows to approximately $944,000. However, with a 1.00% expense ratio, that same portfolio reaches only $815,000.
That 0.90 percentage point difference represents $129,000 in lost wealth, money transferred from the investor to the fund company. This calculation demonstrates why understanding expense ratios matters far beyond simple annual costs.
| Investment Duration | 0.10% Ratio | 0.50% Ratio | 1.00% Ratio | Wealth Difference |
|---|---|---|---|---|
| 10 Years | $142,000 | $140,000 | $138,000 | $4,000 |
| 20 Years | $420,000 | $408,000 | $397,000 | $23,000 |
| 30 Years | $944,000 | $894,000 | $815,000 | $129,000 |
| 40 Years | $2,048,000 | $1,880,000 | $1,628,000 | $420,000 |
These projections assume $10,000 annual contributions and 7% pre-fee returns.
The Compounding Effect
Expense ratios exert their influence through the powerful mechanism of compound interest working in reverse. Each year, fees reduce not only current returns but also the base amount available for future growth. This compounding drag accelerates over time, which explains why seemingly minor fee differences create massive wealth disparities across multi-decade periods.
Historical market analysis reveals that investors who minimized expenses consistently outperformed those who prioritized other factors like past performance or star managers. Research spanning decades shows that low-cost funds rank among the most reliable predictors of superior long-term results, outweighing factors like management tenure or fund size.
Different Investment Vehicles and Their Costs
Various investment products carry distinctly different expense ratio structures, reflecting their management approaches and operational complexity. Understanding these differences helps investors make appropriate choices for their specific situations and goals.
Actively Managed Mutual Funds
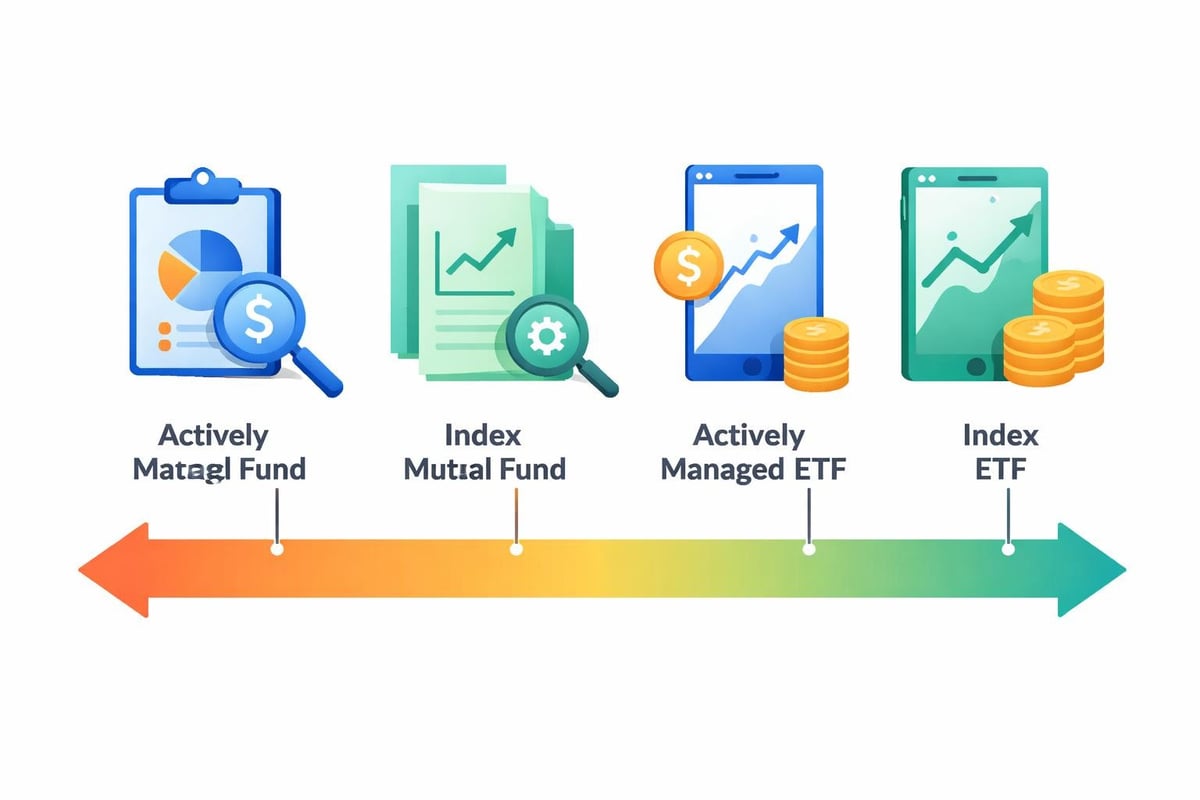
Traditional actively managed funds employ research teams and portfolio managers who attempt to outperform market benchmarks through security selection and market timing. This intensive approach generates substantial costs, typically resulting in expense ratios between 0.50% and 1.50% for equity funds.
Bond funds generally charge less, ranging from 0.40% to 1.00%, reflecting the lower research intensity required for fixed-income investing. Specialized sector funds and international funds often command higher fees, sometimes exceeding 2.00%, justified by the complexity and cost of their investment mandates.
Index Funds and ETFs
Passive investment vehicles revolutionized the industry by offering broad market exposure at minimal cost. Index funds and ETFs typically carry expense ratios below 0.20%, with many major providers offering options under 0.05%. This dramatic cost advantage stems from their rules-based approach, which eliminates expensive research teams and reduces portfolio turnover.
The efficiency of passive investing becomes particularly evident when examining historical performance data. From 1990 through 2026, the majority of actively managed funds failed to outperform their benchmark indexes after accounting for fees, validating the low-cost approach advocated by index fund proponents.
Fee Trends Through Market History
Analyzing expense ratio evolution provides fascinating insights into competitive dynamics within the financial services industry. The average equity mutual fund expense ratio peaked during the late 1990s at approximately 1.04%, coinciding with the dot-com bubble when investors prioritized access to hot sectors over cost considerations.
Following the 2008 financial crisis, investor awareness of fees increased substantially. Media coverage, regulatory pressure, and academic research highlighting fee impact combined to accelerate the shift toward lower-cost options. By 2020, the average equity fund expense ratio had declined to approximately 0.47%, representing a 55% reduction from peak levels.
Regulatory Influence
Government oversight has played a crucial role in fee transparency and competition. The Securities and Exchange Commission mandated standardized expense ratio disclosure in fund prospectuses, enabling easier comparison shopping. This transparency empowered investors to make cost-conscious decisions, forcing high-fee providers to justify their charges or lower them.
Additional regulations required funds to separate various fee components, preventing companies from obscuring true costs through complex fee structures. These reforms, implemented gradually over decades, contributed significantly to the downward fee pressure observed across the industry.
Evaluating Expense Ratios in Context
While lower expense ratios generally benefit investors, context matters when evaluating fund costs. Certain specialized investment strategies legitimately require higher expenses due to their complexity, research requirements, or operational costs.
Factors to consider beyond the expense ratio itself include:
- Fund category and investment strategy complexity
- Historical performance relative to appropriate benchmarks
- Tax efficiency and turnover rates
- Fund size and economies of scale
- Share class structure and available options
- Additional costs like trading commissions or loads
Historical Performance Patterns
Market history demonstrates that expense ratios correlate strongly with investor outcomes. Morningstar research spanning multiple decades consistently shows that low-cost fund quintiles outperform high-cost quintiles across virtually all asset categories and time periods.
This relationship holds even when controlling for other factors like fund size, manager tenure, and investment style. The persistence of this pattern across different market environments, from bull markets to bear markets, reinforces the fundamental importance of minimizing costs.
| Cost Quintile | 10-Year Success Rate | 15-Year Success Rate | Average Outperformance |
|---|---|---|---|
| Lowest Cost | 62% | 71% | +1.2% annually |
| Second Quintile | 48% | 54% | +0.4% annually |
| Middle Quintile | 39% | 42% | -0.1% annually |
| Fourth Quintile | 30% | 31% | -0.6% annually |
| Highest Cost | 21% | 18% | -1.1% annually |
Success rate measures percentage of funds that survived and outperformed category average.
Small Differences, Major Outcomes
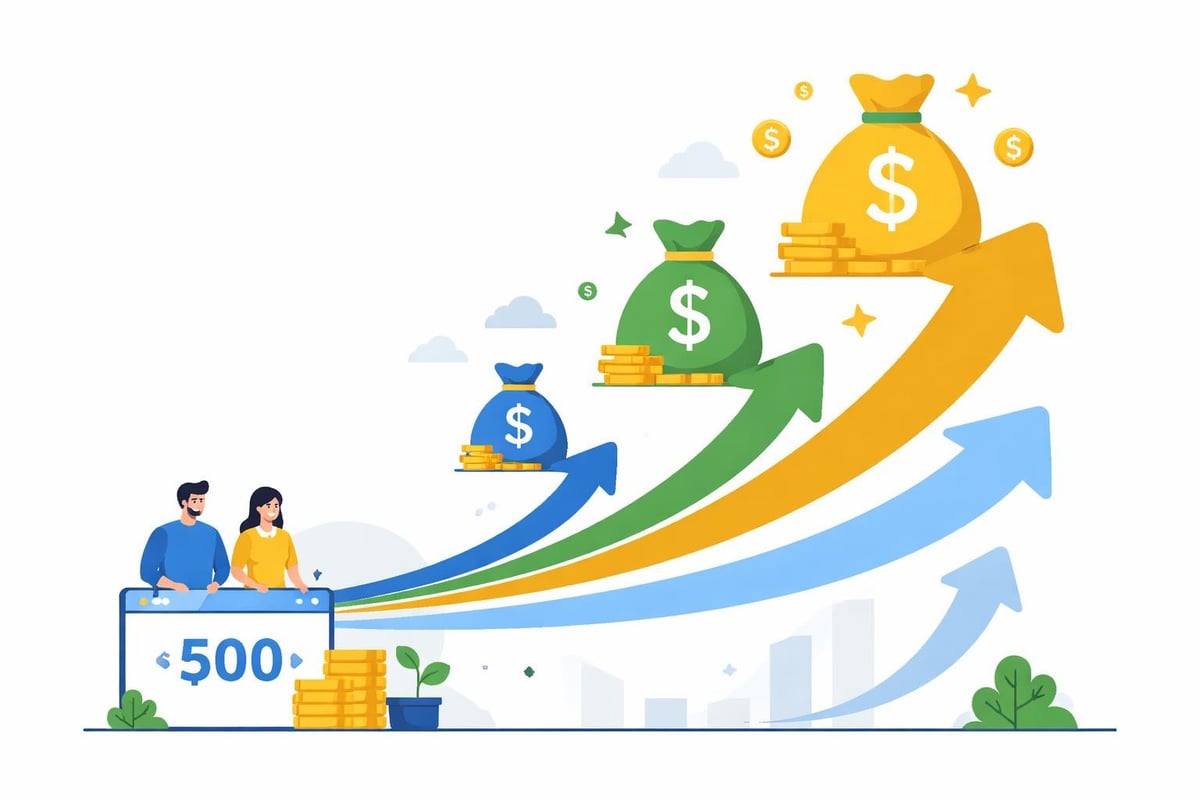
The mathematical power of compounding magnifies small expense ratio differences into substantial wealth disparities. Consider how a seemingly minor variation affects retirement savings accumulated over a full career. An investor contributing $500 monthly for 40 years earning 8% annually before fees would accumulate different results based on expense ratios:
At 0.05%, the portfolio reaches $1,740,000. At 0.25%, it grows to $1,655,000. At 0.75%, the total becomes $1,498,000. At 1.50%, the final value drops to $1,297,000. The spread between lowest and highest represents $443,000, or 25% of the potential wealth.
Breaking Down the Numbers
Each additional basis point in fees extracts value throughout the investment journey. Over multi-decade periods, these costs represent not just the fee percentage itself but also the lost opportunity for those dollars to compound and generate additional returns. This opportunity cost often exceeds the direct fee amount, creating a multiplier effect that amplifies the true cost of higher expense ratios.
Historical analysis of actual investor outcomes confirms these theoretical projections. Studies tracking cohorts of investors over 20-30 year periods show that those who consistently chose low-cost options accumulated significantly more wealth than peers who selected funds based on other criteria like recent performance or brand recognition.
Industry Response and Innovation
The competitive pressure created by fee-conscious investors has driven remarkable innovation within the asset management industry. Major fund companies have responded to market demands by launching ultra-low-cost index funds, some with expense ratios below 0.03%. This race to the bottom benefits investors but challenges traditional business models built on higher fee structures.
Some companies have introduced zero-fee index funds, eliminating expense ratios entirely on select products. These offerings typically recoup costs through securities lending revenue or serve as loss leaders to attract customers to other profitable products. While innovative, investors should understand the full economics behind such offerings.
Evolution of Share Classes
Fund companies historically offered multiple share classes with different fee structures targeting various investor types. Class A shares charged upfront loads but lower ongoing expenses. Class C shares eliminated upfront loads but carried higher annual fees. Institutional shares provided the lowest expense ratios but required substantial minimum investments.
Recent years have seen simplification as companies eliminate complex share class structures in favor of transparent, investor-friendly options. This evolution reflects both regulatory pressure and competitive dynamics, as firms recognize that complexity often disguises high costs and discourages investment.
Strategic Considerations for Investors
Historical market patterns suggest several practical strategies for expense ratio optimization. First, prioritize low-cost options within each asset class unless compelling evidence justifies higher fees. Second, review expense ratios across your entire portfolio, not just individual holdings, to understand total cost burden.
Effective expense management techniques include:
- Replacing high-cost active funds with low-cost index alternatives
- Consolidating assets to access institutional share classes
- Using tax-advantaged accounts strategically for less efficient investments
- Monitoring expense ratios annually as funds adjust their fees
- Comparing similar funds using standardized expense ratio data
The Active Management Exception
While passive investing dominates cost-conscious portfolios, certain active strategies have demonstrated value despite higher fees. Niche market segments with limited index options, specialized fixed-income strategies, and alternative investments sometimes justify elevated expense ratios through superior risk-adjusted returns.
Historical analysis shows that truly skilled active managers exist, though identifying them prospectively remains challenging. Investors considering higher-cost active funds should examine long-term track records spanning multiple market cycles, understanding that past performance doesn't guarantee future results.
Expense Ratios in Broader Financial Context
Understanding expense ratios connects to broader financial literacy and wealth-building principles. Just as operating margins matter for corporate profitability, investment costs directly impact personal financial outcomes. Minimizing expenses represents one of the few controllable variables in investing, unlike market returns or economic conditions.
The expense ratio concept extends beyond mutual funds and ETFs. Similar fee structures affect annuities, target-date funds, and separately managed accounts. Applying the same analytical framework across all investment products helps investors make consistent, cost-conscious decisions throughout their financial lives.
| Product Type | Typical Expense Ratio | Additional Costs | Total Annual Cost |
|---|---|---|---|
| Index ETF | 0.03% to 0.15% | Trading commissions | 0.03% to 0.20% |
| Index Mutual Fund | 0.05% to 0.20% | None (no-load) | 0.05% to 0.20% |
| Active Mutual Fund | 0.50% to 1.50% | Possible load fees | 0.50% to 2.00% |
| Target-Date Fund | 0.10% to 1.00% | Underlying fund fees | 0.10% to 1.20% |
| Variable Annuity | 1.00% to 2.50% | M&E, admin fees | 2.00% to 4.00% |
Costs shown as annual percentages of assets under management.
Fee Compression and Market Access
The dramatic decline in expense ratios has democratized investment access, enabling small-cap stock exposure and international diversification at minimal cost. Investors in 2026 can build globally diversified portfolios with total expense ratios under 0.10%, something impossible during earlier market eras.
This fee compression has particularly benefited retirement savers and young investors with limited capital. The ability to access sophisticated investment strategies at institutional costs accelerates wealth accumulation for those who begin investing early and maintain disciplined contributions over time.
Technology's Role
Technological advancement has driven much of the expense ratio reduction observed over recent decades. Automated portfolio management, electronic trading, and digital client servicing dramatically reduced operational costs for fund providers. These efficiency gains enabled companies to lower fees while maintaining profitability, creating a virtuous cycle benefiting investors.
The rise of robo-advisors further compressed costs by automating investment selection, rebalancing, and tax-loss harvesting. These platforms typically charge 0.25% to 0.50% annually while investing client assets in low-cost ETFs, creating total costs comparable to direct index fund investing with added convenience.
Learning from Market History
Studying expense ratio evolution through different market periods reveals valuable patterns applicable to current investment decisions. During the 1990s bull market, investors largely ignored costs as strong returns masked fee impact. The subsequent bear market of 2000-2002 refocused attention on fees as investors realized that costs continued regardless of market performance.
Analyzing historical market movements demonstrates how expense ratios function as a constant drag on returns across all market conditions. Bull markets, bear markets, and sideways periods all equally suffer from fee erosion, making cost control essential regardless of economic outlook.
The 2008 financial crisis accelerated fee awareness as investors sought to control what they could during market turmoil. This shift permanently altered industry dynamics, establishing low-cost investing as a mainstream approach rather than a fringe strategy. Understanding this historical evolution helps contextualize current fee structures and anticipate future trends.
Expense ratios represent one of the most predictable and controllable factors affecting long-term investment success, with historical evidence consistently demonstrating their profound impact on wealth accumulation. By examining how these costs have evolved and influenced market outcomes across different eras, investors gain valuable perspective for optimizing their own portfolios. Historic Financial News provides the historical context and analytical tools needed to understand how fee structures have shaped investor outcomes throughout market history, helping you spot patterns and make informed decisions based on decades of market data rather than short-term trends.