
Coupon Rate: Definition, History, and Market Impact
Understanding fixed-income securities requires grasping one fundamental concept that has remained constant throughout market history. The coupon rate represents the annual interest payment that a bond issuer commits to pay bondholders, expressed as a percentage of the bond's face value. This metric has guided investment decisions for over a century, from the Liberty Bonds of World War I through the volatile interest rate environments of the 1970s and 1980s, to today's complex bond markets in 2026. For anyone studying historical market movements and patterns, examining how coupon rates have evolved provides essential context for understanding capital markets and investor behavior across different economic cycles.
The Fundamental Definition of Coupon Rate
The coupon rate establishes the fixed annual interest payment a bondholder receives throughout the life of the bond. According to the U.S. Securities and Exchange Commission, this rate is set at issuance and remains unchanged regardless of fluctuations in market interest rates or bond prices. The term "coupon" originated from physical certificates that bondholders would clip and redeem for interest payments before electronic systems became standard.
Calculating Interest Payments
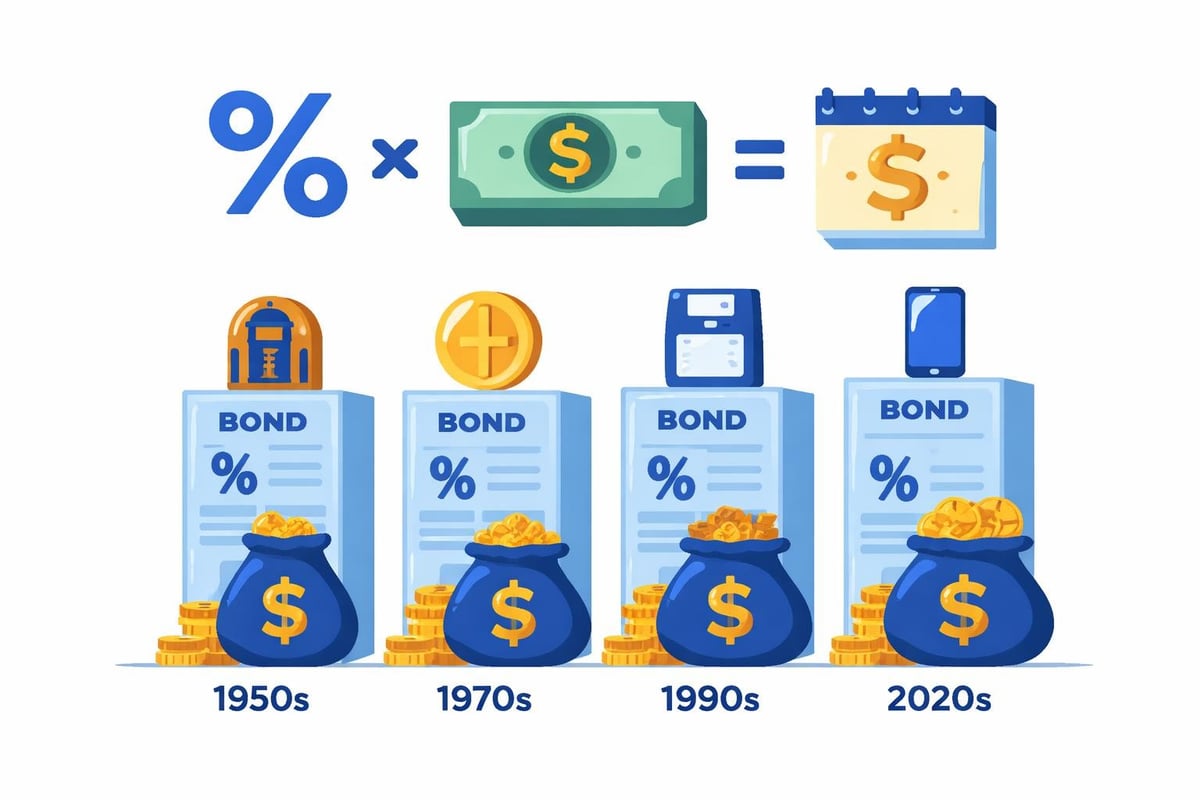
The calculation follows a straightforward formula that has remained consistent since the early development of modern bond markets:
Annual Interest Payment = Face Value × Coupon Rate
For example, a bond with a $1,000 face value and a 5% coupon rate pays $50 annually. Most bonds distribute these payments semi-annually, meaning investors receive $25 every six months. This predictable payment structure made bonds particularly attractive to conservative investors throughout the 20th century, especially during periods when stock market volatility drove demand for stable income streams.
The relationship between coupon rate and actual payments becomes particularly important when examining historical bond issuances. During the post-World War II era, corporate bonds frequently carried coupon rates between 3% and 5%, reflecting the relatively stable interest rate environment. By contrast, the inflationary period of the late 1970s saw new bond issuances with coupon rates exceeding 12% or even 15%, as issuers competed to attract capital in an environment where investors demanded compensation for inflation risk.
Historical Evolution of Coupon Rates
The trajectory of coupon rates throughout financial history mirrors broader economic trends and monetary policy decisions. During the 1920s, high-quality corporate bonds typically offered coupon rates between 4% and 6%, considered generous returns in that era's deflationary environment. The Great Depression disrupted these patterns, with many issuers defaulting while others maintained payments despite severe economic stress.
The Post-War Era Through the 1960s
Following World War II, the bond market entered a period of relative stability. Government securities carried modest coupon rates, often below 4%, while corporate bonds offered slightly higher rates to compensate for credit risk. This environment fostered the growth of institutional bond investing, as pension funds and insurance companies built portfolios around predictable income streams. The concept of basis points became increasingly important for measuring small differences in yields between securities with similar characteristics.
The stability of this era created investor expectations that would be dramatically challenged in subsequent decades. Bond investors assumed that coupon rates would remain within a narrow range, and many financial models incorporated this assumption. These expectations influenced everything from retirement planning to corporate capital structure decisions.
The Inflationary Shock of the 1970s and 1980s
The 1970s fundamentally altered the coupon rate landscape. As inflation accelerated, existing bonds with lower coupon rates suffered severe price declines. Investors demanded higher coupon rates on new issuances to compensate for inflation risk and the opportunity cost of locking in rates that might quickly become inadequate. By 1981, when the Federal Reserve under Paul Volcker pushed interest rates to unprecedented levels, newly issued corporate bonds carried coupon rates exceeding 15%.
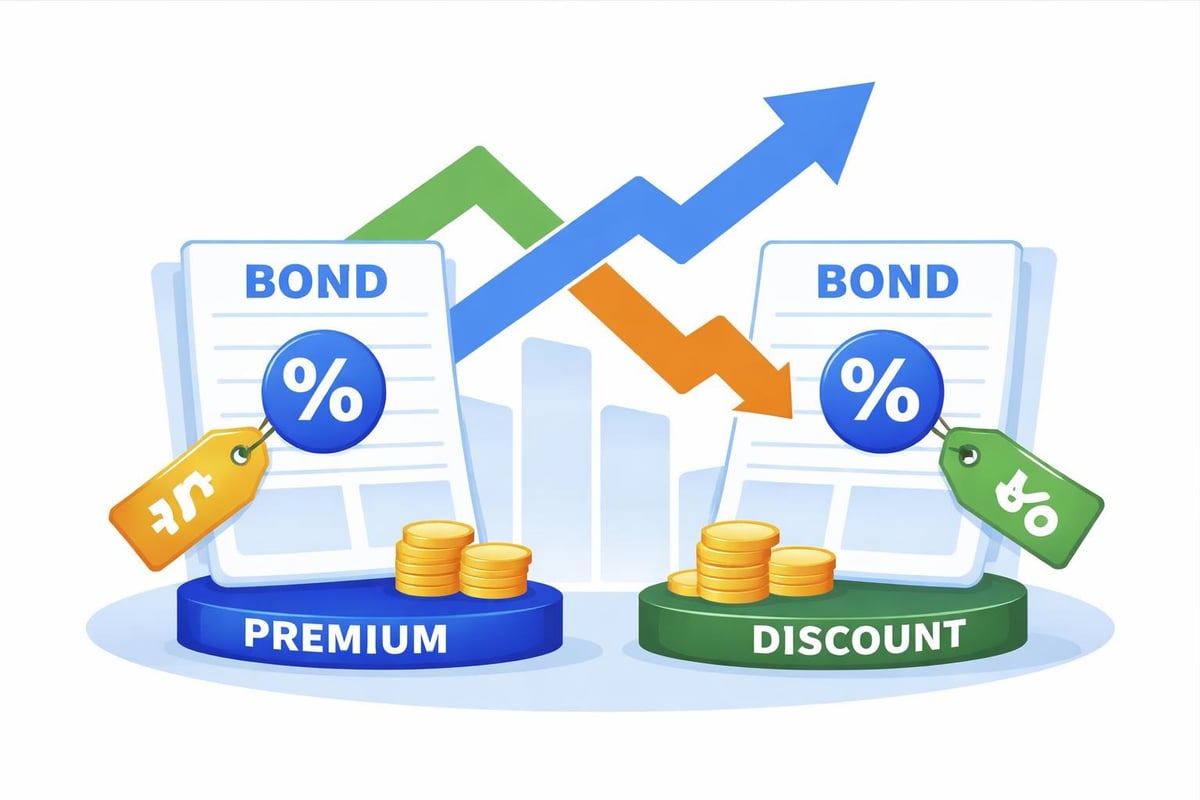
This period demonstrated a crucial lesson that remains relevant for students of market history: the inverse relationship between bond prices and interest rates becomes dramatically visible when coupon rates diverge significantly from prevailing market rates. As Britannica explains, bonds with lower coupon rates than current market rates trade at discounts to face value, while those with higher coupon rates command premiums.
| Historical Period | Typical Corporate Bond Coupon Rates | Key Economic Characteristics |
|---|---|---|
| 1920s | 4% - 6% | Stable prices, deflationary pressures |
| 1950s - 1960s | 3% - 5% | Post-war stability, controlled inflation |
| 1970s - Early 1980s | 8% - 15% | High inflation, volatile monetary policy |
| 1990s - 2000s | 5% - 8% | Declining inflation, financial innovation |
| 2010s - 2020s | 2% - 5% | Low interest rate environment, QE policies |
Coupon Rate Versus Yield: Critical Distinctions
Understanding the difference between coupon rate and yield proves essential for analyzing historical bond market behavior. The coupon rate remains fixed, but yield fluctuates based on the bond's current market price. SmartAsset provides detailed explanations of how these metrics interact, which becomes particularly important when examining bonds trading in secondary markets.
Current Yield and Yield-to-Maturity
When a bond trades at its original face value, the current yield equals the coupon rate. However, price movements create divergences. A bond purchased below face value generates a current yield exceeding its coupon rate, while bonds bought at premiums offer current yields below the stated coupon rate. This relationship shaped investment strategies throughout market history.
Yield-to-maturity incorporates both coupon payments and any capital gain or loss realized when the bond reaches its maturity date. During periods when interest rates fell substantially, such as the 2010s, investors purchasing older bonds with higher coupon rates enjoyed both superior income and capital appreciation as those bonds traded at premiums. The differences between these yield measures highlight why historical bond performance analysis requires examining multiple metrics simultaneously.
Market Impact and Investor Behavior
Coupon rates significantly influence investor decisions and market dynamics. Higher coupon rates provide more substantial cash flows, which particularly attracts income-focused investors such as retirees and institutions with regular payment obligations. Throughout financial history, these preferences have shaped market demand patterns.
Risk Assessment and Credit Quality
Issuers with lower credit quality must offer higher coupon rates to compensate investors for additional default risk. This relationship became starkly evident during the development of the high-yield (or "junk") bond market in the 1980s. Companies with speculative-grade credit ratings issued bonds with coupon rates substantially exceeding those of investment-grade securities. This differential persists today, providing investors with clear signals about relative risk levels.
The spread between high-quality government bonds and corporate bonds with various credit ratings serves as a crucial market indicator. During the 2008 financial crisis, these spreads widened dramatically as investors demanded higher coupon rates to accept corporate credit risk. Examining historical spread patterns reveals how market participants assess economic conditions and future default probabilities.
Interest Rate Risk and Duration
Bonds with lower coupon rates exhibit greater price sensitivity to interest rate changes, a characteristic measured by duration. This mathematical relationship means that during periods of rising interest rates, bonds issued during low-rate environments experience more severe price declines than bonds with higher coupon rates. The 2022-2023 Federal Reserve tightening cycle demonstrated this principle dramatically, as bonds issued during the ultra-low rate environment of 2020-2021 suffered substantial mark-to-market losses.
Investors studying historical patterns can observe how coupon rate levels influenced portfolio strategies across different interest rate cycles. During rising rate environments, floating rate securities gained popularity precisely because they avoided the duration risk associated with fixed coupon rates.
Special Coupon Rate Structures
While traditional fixed-rate bonds dominate, various coupon rate structures have emerged throughout financial market evolution. Zero-coupon bonds eliminate periodic interest payments entirely, instead issuing at deep discounts to face value. These instruments became increasingly popular during the 1980s for specific investment strategies, particularly tax-advantaged retirement accounts where investors could defer taxation on imputed interest.
Step-Up and Floating Rate Bonds
Step-up bonds feature predetermined coupon rate increases at specified intervals. These structures emerged as innovations to address investor concerns about interest rate risk while providing issuers with initially lower financing costs. The step-up feature offers partial protection against rising rate environments, though the predetermined schedule may not match actual market movements.
Floating rate bonds tie coupon payments to reference rates such as SOFR (Secured Overnight Financing Rate) or historical benchmarks like LIBOR. These instruments gained prominence during volatile interest rate periods when investors sought protection against the erosion of fixed coupon payments' purchasing power. Understanding how floating rates work provides context for appreciating why these structures become more or less popular depending on economic conditions.
Convertible Bonds
Convertible bonds typically offer lower coupon rates than comparable straight debt because they provide conversion rights to equity. This trade-off between current income and potential capital appreciation has attracted investors throughout market history. During periods of strong equity market performance, such as the 1990s technology boom, convertible issuance surged as companies could reduce their coupon rate obligations while offering investors participation in potential stock price gains.
Analyzing Historical Bond Issuances
Examining specific historical bond issuances reveals how coupon rates reflected contemporary economic conditions and issuer circumstances. The Liberty Bonds issued during World War I carried relatively modest coupon rates of 3.5% to 4.25%, considered attractive given the patriotic appeal and government backing. These bonds established precedents for large-scale government debt issuance that would be repeated during World War II and subsequent periods.
Corporate Bond Markets Through the Decades
Major corporations have used bond markets continuously since the late 19th century, with coupon rates serving as key competitive factors in capital raising. AT&T, historically one of the largest corporate bond issuers, provides an instructive case study. During the stable 1950s and 1960s, AT&T bonds typically carried coupon rates between 3% and 5%. By the early 1980s, the company issued bonds with coupon rates exceeding 14% to compete in the high-rate environment created by Federal Reserve policy.
The comparison between bonds issued by the same high-quality company across different periods illustrates how macroeconomic conditions overwhelm company-specific factors in determining coupon rates. As Kiplinger explains in their bond overview, understanding these historical patterns helps investors contextualize current market conditions.
| Notable Historical Bond Issuances | Coupon Rate | Context and Significance |
|---|---|---|
| Liberty Bonds (1917-1918) | 3.5% - 4.25% | War financing, patriotic appeal |
| AT&T Bonds (1960s) | 4% - 5% | Stable rate environment, high credit quality |
| U.S. Treasury Bonds (1981) | 14%+ | Peak of inflation fight, highest modern rates |
| Apple Inc. Bonds (2013) | 2.4% - 3.85% | Return to bond market after years of cash accumulation |
| U.S. Treasury 10-Year (2020) | ~0.6% | Pandemic response, ultra-low rate environment |
Coupon Rates in Modern Portfolio Management
Contemporary investment strategies incorporate coupon rate analysis within broader frameworks that consider total return, tax efficiency, and risk-adjusted performance. The laddering strategy, which involves purchasing bonds with staggered maturities and varying coupon rates, has remained popular since the mid-20th century. This approach provides regular cash flows while managing reinvestment risk as bonds mature at different times.
Tax Considerations
Coupon payments generally receive taxation as ordinary income, creating tax efficiency considerations that influence investor preferences. Municipal bonds often carry lower coupon rates than comparable taxable bonds because their interest payments receive federal (and sometimes state) tax exemptions. The after-tax yield comparison between taxable and tax-exempt bonds with different coupon rates has driven allocation decisions for high-net-worth investors throughout market history.
During periods when marginal tax rates reached extremely high levels, such as the post-World War II decades when top rates exceeded 90%, the coupon rate differential between taxable and tax-exempt securities widened substantially. Analyzing these historical relationships provides insight into how fiscal policy influences market structure.
Institutional Investment Mandates
Pension funds, insurance companies, and other institutional investors often maintain allocation requirements tied to income generation. These mandates create consistent demand for bonds with higher coupon rates, regardless of total return considerations. During the low-rate environment of the 2010s and early 2020s, institutions seeking adequate coupon income increasingly moved toward longer-duration bonds or lower credit quality securities, accepting additional risks to achieve required income levels.
The search for yield phenomenon that characterized much of the post-2008 period demonstrates how coupon rate availability influences broader market behavior. Understanding cash flow requirements helps explain why institutional investors prioritize coupon income differently than total return-focused investors.
Global Perspectives on Coupon Rates
Bond markets across different countries have exhibited varying coupon rate patterns based on local economic conditions, monetary policies, and currency considerations. Japanese government bonds carried coupon rates below 2% throughout much of the 1990s and 2000s, reflecting that country's deflationary environment and ultra-loose monetary policy. By contrast, emerging market bonds frequently offered coupon rates of 8% or higher to compensate investors for currency risk, political uncertainty, and credit concerns.
Currency and Sovereign Risk
The coupon rate on sovereign bonds issued in foreign currencies incorporates compensation for exchange rate risk. Throughout the 1980s and 1990s, many developing countries issued dollar-denominated bonds with elevated coupon rates to attract international capital. These issuances created opportunities and risks that became evident during various emerging market crises, from the Latin American debt problems of the 1980s through the Asian financial crisis of 1997-1998.
Comparing coupon rates across jurisdictions requires adjusting for multiple risk factors. A 7% coupon rate on a Brazilian government bond in the early 2000s represented different risk-return characteristics than a 7% coupon on a U.S. corporate bond during the same period. Historical analysis reveals how global capital flows respond to these differentials and how periodic crises reset market expectations.
Lessons from Historical Coupon Rate Analysis
Studying coupon rate patterns across market cycles reveals enduring principles that remain relevant for contemporary investors. The relationship between coupon rates and economic conditions provides early signals of policy directions and market expectations. When the Federal Reserve began raising rates in 2022, newly issued bonds quickly reflected higher coupon rates, while existing low-coupon bonds experienced price declines that affected portfolio valuations across the investment landscape.
The importance of matching investment timeframes with bond characteristics has proven consistent throughout financial history. Investors requiring near-term liquidity face different considerations than those who can hold bonds to maturity, collecting the stated coupon rate regardless of interim price fluctuations. Historical market analysis demonstrates how these strategic considerations have influenced successful long-term investment approaches.
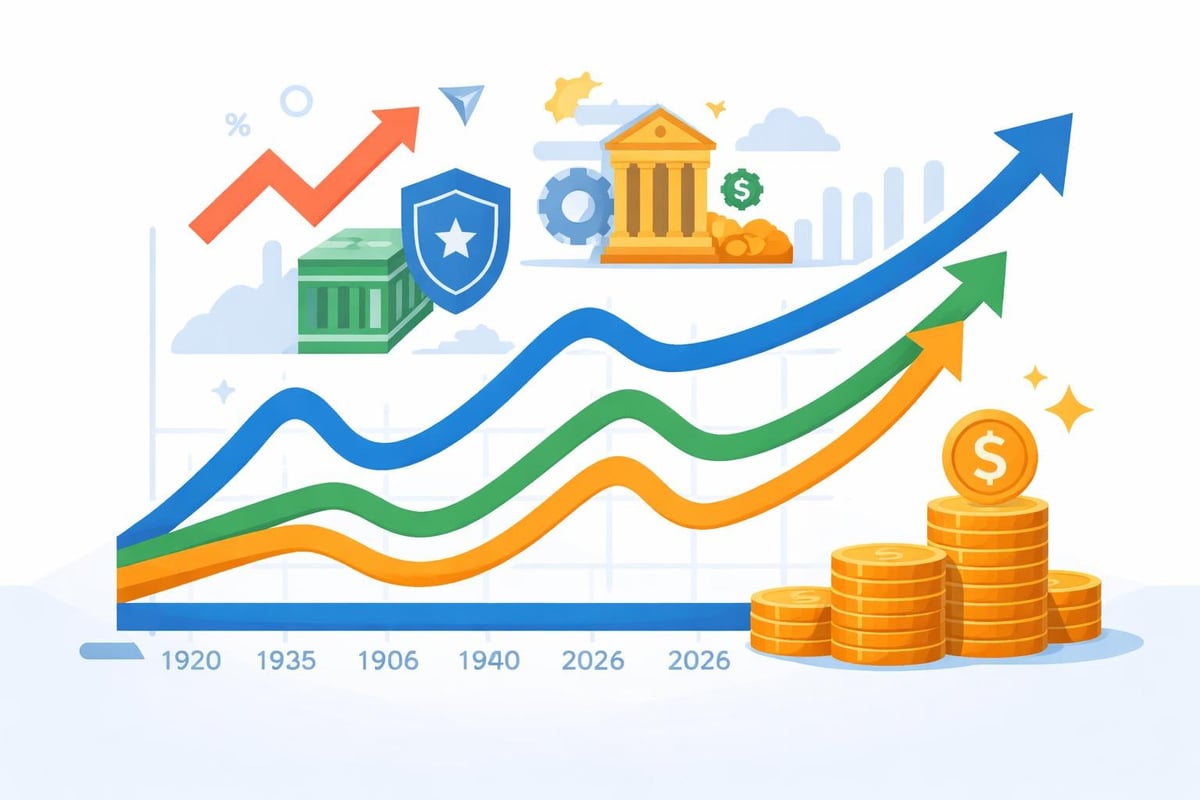
Pattern Recognition Across Cycles
Examining historical coupon rate data reveals cyclical patterns tied to broader economic conditions. The multi-decade decline in interest rates from the early 1980s through 2020 created a prolonged environment where newly issued bonds consistently carried lower coupon rates than outstanding issues. This trend reversed dramatically in 2022-2023, presenting challenges for investors who had only experienced falling rate environments.
Recognition of these patterns helps investors anticipate potential outcomes based on historical precedent while remaining alert to genuinely new developments. The unprecedented negative interest rates observed in some European and Japanese markets during the 2010s created situations where bonds technically carried negative coupon rates, representing a historically unique phenomenon that challenged traditional bond valuation models.
Understanding coupon rates through historical context illuminates both the consistency of fundamental principles and the evolution of market practices across different economic environments. By examining how these fixed interest payments have shaped investor behavior, market dynamics, and economic outcomes from the 1920s through 2026, market participants gain valuable perspective on contemporary conditions. Historic Financial News provides the tools and context to explore these patterns in depth, offering interactive charts and AI-powered analysis that connect historical coupon rate data with broader market movements, helping investors, researchers, and students learn from past cycles to make more informed decisions today.