
Blue Chip Stock: A Historical Guide for Investors
The term "blue chip stock" has been synonymous with quality and reliability in financial markets for nearly a century. These elite company shares represent the foundation of countless investment portfolios, offering a combination of stability, consistent performance, and dependable dividend payments that have weathered numerous economic storms. For investors seeking to understand market patterns through historical analysis, examining the characteristics and evolution of these premium equities provides invaluable insights into how certain companies maintain their leadership positions across decades. The historical record reveals that blue chip stocks have played a pivotal role in shaping market indices and investor strategies, from the Dow Jones Industrial Average's inception to today's technology-driven marketplace.
Historical Origins of the Blue Chip Designation
The term "blue chip" originated from poker, where blue chips traditionally held the highest value at the table. Oliver Gingold, a financial journalist working for Dow Jones in the 1920s, reportedly coined the phrase while observing stocks trading at $200 per share or higher. This casual observation evolved into a formal investment classification that would shape portfolio construction for generations.
During the early twentieth century, companies like U.S. Steel, General Electric, and American Telephone & Telegraph exemplified the characteristics that would define this category. These corporations demonstrated exceptional financial strength, maintained dominant market positions, and survived the economic turbulence of their era. The Great Depression of the 1930s tested these companies severely, yet many survived where countless others failed.

Defining Characteristics Through Time
What separates a blue chip stock from ordinary equities remains consistent across market cycles. Understanding blue chip stocks requires examining several key attributes that persist regardless of economic conditions.
Financial stability represents the cornerstone of blue chip status. These companies maintain strong balance sheets with manageable debt levels and substantial cash reserves. Historical data shows that blue chip corporations typically demonstrate superior debt-to-equity ratios compared to their peers, providing cushions during economic downturns.
Market capitalization serves as another defining factor. Blue chip stocks generally rank among the largest publicly traded companies, often exceeding tens or hundreds of billions in market value. This size provides competitive advantages including economies of scale, pricing power, and resources for innovation.
Dividend consistency distinguishes blue chips from growth-oriented stocks. Many blue chip companies have paid dividends continuously for decades, with some increasing payments annually for twenty-five years or more, earning them "dividend aristocrat" status.
Market Performance Across Economic Cycles
Examining blue chip performance through historical market events reveals patterns that continue influencing investment decisions. The 1973-1974 recession demonstrated how these stocks, while not immune to decline, typically recovered faster than smaller competitors. During this period, blue chip companies with diversified revenue streams and international exposure weathered inflation and economic stagnation more effectively.
The dot-com bubble of the late 1990s presented an interesting case study. Traditional blue chip stocks temporarily underperformed speculative technology ventures, leading some analysts to question their relevance. However, when the bubble burst in 2000-2002, blue chip stocks demonstrated their defensive characteristics, maintaining dividends and preserving capital while numerous high-flying startups disappeared.
| Economic Event | Blue Chip Performance | Recovery Timeline | Key Lesson |
|---|---|---|---|
| 1973-1974 Recession | Declined but maintained dividends | 18-24 months | Dividend sustainability matters |
| 1987 Black Monday | Sharp drop, quick recovery | 6-12 months | Liquidity provides resilience |
| 2000-2002 Dot-com Crash | Outperformed growth stocks | 12-18 months | Fundamentals outlast speculation |
| 2008 Financial Crisis | Significant decline, some suspended dividends | 24-36 months | Even blue chips face systemic risk |
| 2020 Pandemic | Initial sharp drop, rapid recovery | 3-6 months | Diversification across sectors critical |
The 2008 financial crisis challenged conventional assumptions about blue chip invulnerability. General Motors and Citigroup, long-standing blue chip names, required government intervention to survive. This period reinforced that blue chip status requires continuous evaluation rather than permanent designation.
Sector Representation and Evolution
The composition of blue chip stocks reflects economic transformation over time. In the 1950s and 1960s, industrial manufacturers and consumer goods companies dominated blue chip rankings. Companies like DuPont, Procter & Gamble, and General Motors represented American economic might.
The 1980s and 1990s witnessed the rise of technology companies into blue chip territory. IBM transitioned from business equipment manufacturer to technology leader, while Microsoft and Intel established dominant positions in software and semiconductors. This shift illustrated how blue chip status evolves with economic structure.
The twenty-first century accelerated technological representation among blue chips. Amazon, Apple, and Alphabet achieved market capitalizations exceeding traditional industrial giants, demonstrating superior growth while maintaining the financial stability characteristic of blue chip designation. Understanding the cash flow statements of these technology leaders reveals how they generate the consistent earnings that justify their blue chip status.
Investment Strategies Using Blue Chip Stocks
Historical analysis reveals several approaches investors have employed when incorporating these premium equities into portfolios. Each strategy offers distinct advantages depending on market conditions and individual goals.
Buy-and-hold strategies represent the most traditional approach. Investors purchase blue chip stocks with intentions to maintain positions for decades, collecting dividends and benefiting from long-term appreciation. Warren Buffett's Berkshire Hathaway exemplifies this philosophy, holding positions in companies like Coca-Cola and American Express for multiple decades.
Dividend reinvestment programs allow investors to compound returns by automatically purchasing additional shares with dividend payments. Historical data demonstrates how this approach accelerates wealth accumulation, particularly during market downturns when reinvested dividends purchase shares at depressed prices.

Tactical rotation strategies involve shifting allocations between blue chip sectors based on economic conditions. During inflationary periods, energy and materials companies may outperform, while technology and consumer discretionary stocks often lead during economic expansions.
Risk Considerations and Historical Lessons
Despite their reputation for stability, blue chip stocks carry risks that historical analysis helps illuminate. Concentration risk emerges when blue chip names dominate indices, as occurred with technology stocks in 2021-2022. Investors heavily weighted toward these companies experienced significant volatility as market conditions shifted.
Dividend cuts represent another historical risk factor. Even established blue chip companies occasionally reduce or eliminate dividends during severe economic stress. The 2008 financial crisis saw multiple blue chip banks slash dividends, disappointing income-focused investors who assumed these payments were guaranteed.
Technological disruption threatens blue chip status more rapidly than in previous eras. Companies that dominated their industries for decades can lose relevance within years as innovation accelerates. Kodak, once a blue chip photography leader, failed to adapt to digital cameras despite inventing the technology internally.
- Complacency risk: Assuming blue chip status guarantees future performance
- Valuation risk: Overpaying for quality during market euphoria
- Currency risk: International exposure creates exchange rate sensitivity
- Regulatory risk: Government policy changes affecting dominant companies
- Competitive risk: New entrants disrupting established business models
Comparing Blue Chips Across International Markets
Blue chip stocks exist in every developed market, though characteristics vary by region. European blue chips like Nestlé, Siemens, and Unilever demonstrate similar stability characteristics as American counterparts but operate within different regulatory frameworks and economic conditions.
Japanese blue chips including Toyota, Sony, and Mitsubishi survived the country's "Lost Decades" following the asset bubble collapse of 1990, demonstrating remarkable resilience despite challenging domestic economic conditions. These companies maintained blue chip status through international diversification and operational excellence.
Emerging markets developed their own blue chip categories as economies matured. Companies like Samsung in South Korea, Tata Group in India, and Petrobras in Brazil achieved dominant positions within their markets while exhibiting characteristics similar to developed market blue chips.
| Region | Representative Blue Chips | Key Characteristics | Historical Challenges |
|---|---|---|---|
| North America | Apple, Microsoft, Johnson & Johnson | Technology leadership, innovation | Regulatory scrutiny, competition |
| Europe | Nestlé, LVMH, Shell | Global brands, dividend history | Currency fluctuation, slower growth |
| Asia-Pacific | Toyota, Samsung, Alibaba | Manufacturing excellence, scale | Geopolitical risk, government influence |
| Emerging Markets | Tata, Petrobras, Naspers | Market dominance, growth potential | Political instability, governance concerns |
Modern Challenges and Opportunities
The investment landscape in 2026 presents both challenges and opportunities for blue chip stocks. Rising interest rates create headwinds for dividend-paying equities as bonds offer competitive yields. However, what are blue chip stocks revealing about adaptation shows these companies increasingly focus on technological transformation to maintain competitiveness.
Environmental, social, and governance (ESG) considerations increasingly influence blue chip strategies. Companies that dominated the twentieth century by focusing solely on profitability now face pressure to demonstrate environmental responsibility and social awareness. This shift creates risks for traditional energy and industrial blue chips while creating opportunities for companies leading sustainability initiatives.
Share buyback programs have emerged as an alternative to dividend increases for returning capital to shareholders. Many blue chip technology companies prefer buybacks, which offer tax advantages and signal management confidence in future prospects. Analyzing historical patterns reveals how effective buyback programs enhance shareholder value when executed at reasonable valuations.
The rise of passive investing through index funds has amplified blue chip stock influence. As capital flows into S&P 500 and similar index funds, the largest blue chip companies receive disproportionate investment, potentially creating valuation disconnects from fundamentals. Understanding these dynamics helps investors identify when blue chips trade at premiums or discounts to historical norms.
Building a Blue Chip Portfolio Framework
Constructing an effective blue chip portfolio requires balancing diversification with concentration in highest-quality names. Historical analysis suggests several principles for portfolio construction.
Sector diversification prevents excessive exposure to single industries. While technology blue chips demonstrate superior growth, combining them with healthcare, consumer staples, and financial blue chips creates more balanced risk profiles. The price-to-earnings ratio analysis across sectors helps identify relative value opportunities.
Quality metrics assessment goes beyond surface-level blue chip designation. Evaluating operating margins, return on equity, and free cash flow generation identifies truly exceptional companies versus those trading on reputation alone.
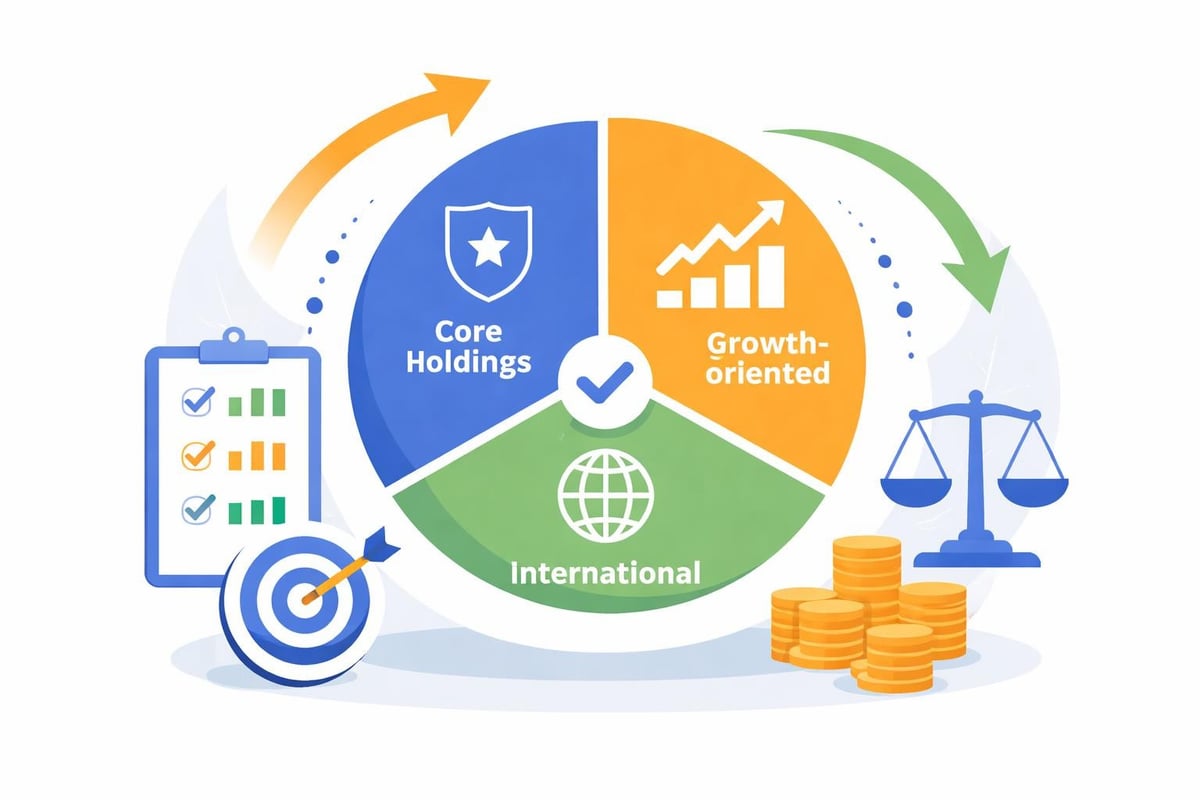
- Establish core holdings: Allocate 40-60% to established blue chips with decades of consistent performance
- Add growth-oriented blue chips: Dedicate 20-30% to newer blue chips with higher growth potential
- Include international exposure: Reserve 15-25% for foreign blue chips providing geographic diversification
- Maintain quality standards: Regularly review holdings to ensure companies maintain blue chip characteristics
- Rebalance systematically: Adjust allocations annually or when individual positions exceed target weightings by 25%
Valuation discipline remains critical even when investing in quality companies. Historical periods of excessive valuation, such as the Nifty Fifty era of the early 1970s, demonstrate how overpaying for quality destroys long-term returns despite owning exceptional businesses.
Learning from Historical Blue Chip Transitions
Perhaps the most valuable lesson from historical analysis involves understanding how blue chip status changes over time. Companies transition into and out of this elite category based on evolving economic conditions, management execution, and competitive dynamics.
Companies ascending to blue chip status typically demonstrate sustained excellence over decades. Microsoft's journey from aggressive growth company to blue chip dividend payer illustrates this transition. The company maintained technological leadership while maturing its financial profile, eventually implementing dividend payments and share buybacks characteristic of blue chip corporations.
Companies losing blue chip designation offer cautionary tales about complacency and disruption. General Electric, a Dow Jones Industrial Average component since 1907, faced declining blue chip status in the 2010s following financial mismanagement and strategic missteps. The company's struggles demonstrated that historical prestige provides no immunity from poor decision-making.
Understanding these transitions helps investors identify emerging blue chips before market recognition fully prices in their quality. Conversely, recognizing deteriorating fundamentals allows investors to exit fading blue chips before significant capital impairment occurs. Resources like The Motley Fool's essential guide provide frameworks for evaluating companies approaching or departing blue chip territory.
The small cap stock category includes tomorrow's potential blue chips, as companies like Amazon and Netflix demonstrated their journeys from small speculative investments to blue chip status within two decades. Identifying these transitions early creates exceptional return opportunities while maintaining focus on quality characteristics that define blue chip investing.
Dividends and Total Return Analysis
Dividend payments represent a defining characteristic of traditional blue chip stocks, though their importance varies across sectors and investment philosophies. Historical analysis reveals how dividend strategies evolved from the primary return source in early twentieth century markets to one component of total return in modern portfolios.
Dividend aristocrats, companies increasing dividends annually for at least twenty-five consecutive years, represent the elite within blue chip categories. These companies demonstrate exceptional capital allocation discipline and business model durability. Historical research shows dividend aristocrats outperformed broader markets during most rolling twenty-year periods since 1990.
Payout ratios indicate sustainability of dividend programs. Blue chip companies typically maintain payout ratios between 40-60% of earnings, providing comfortable margins during economic downturns while returning substantial capital to shareholders. Companies exceeding 80% payout ratios often face dividend cuts during recessions, as 2008-2009 demonstrated across financial sector blue chips.
Dividend growth rates frequently exceed inflation for quality blue chips, providing real income growth over time. Companies increasing dividends at 5-8% annually compound shareholder wealth significantly over multi-decade periods, particularly when combined with dividend reinvestment strategies.
Total return analysis incorporating both dividends and price appreciation reveals blue chip stocks' true investment value. While growth stocks may outperform during bull markets, blue chips' consistent dividend payments cushion returns during bear markets and provide superior risk-adjusted performance across complete market cycles.
Institutional Perspectives and Current Trends
Professional investors including hedge funds, pension funds, and endowments maintain significant blue chip allocations despite sophisticated strategies and alternative investment access. Hedge funds' top blue chip stock selections reflect how even aggressive investors recognize quality equity value.
Pension funds favor blue chips due to liability-matching requirements and capital preservation mandates. These institutions require reliable income streams and principal stability, characteristics blue chip stocks historically provide. Their massive capital allocations influence market pricing and liquidity for these securities.
Sovereign wealth funds from nations like Norway, Singapore, and Saudi Arabia hold substantial blue chip positions as core portfolio components. These long-term investors prioritize wealth preservation across generations, viewing blue chip stocks as superior to bonds for maintaining purchasing power over decades.
Current trends show institutional investors increasingly scrutinizing blue chip companies' competitive positioning in digital transformation. Traditional blue chips that successfully adapt to technological change receive capital inflows, while those struggling with digital competition face redemptions despite historical prestige.
The best blue chip dividend stocks for 2026 reflect this evolution, with institutional favorites including technology companies offering growing dividends alongside traditional sectors like healthcare and consumer staples that demonstrate recession resistance.
Evaluating Financial Health Metrics
Assessing blue chip stock quality requires analyzing specific financial metrics that distinguish truly exceptional companies from merely large ones. Historical patterns reveal which indicators most reliably predict sustained excellence.
Revenue consistency matters more than absolute growth rates. Blue chip companies demonstrate predictable revenue streams even during economic uncertainty. Examining revenue patterns across business cycles reveals whether companies possess pricing power and customer loyalty justifying premium valuations.
Margin stability indicates competitive advantages and operational excellence. Companies maintaining or expanding profit margins during recessions possess business model strengths that support blue chip designation. Analyzing historical margin trends identifies companies with sustainable competitive positions versus those benefiting from temporary favorable conditions.
Balance sheet strength provides the foundation for surviving economic storms. Blue chip companies maintain conservative leverage, substantial cash positions, and manageable capital expenditure requirements relative to cash flow generation.
Financial metrics worth monitoring include:
- Current ratio: Above 1.5 indicates adequate liquidity
- Interest coverage: Exceeding 10x suggests minimal financial distress risk
- Return on equity: Consistently above 15% demonstrates efficient capital deployment
- Free cash flow yield: Comparing free cash flow to market capitalization reveals valuation reasonableness
- Debt maturity profile: Well-structured debt schedules prevent refinancing crises
Blue chip stocks have provided stability, income, and capital appreciation to investors across generations, though the specific companies earning this designation evolve with economic transformation. Understanding historical patterns helps investors identify which characteristics predict sustained excellence versus temporary dominance, enabling more informed portfolio construction decisions. Historic Financial News offers the tools and historical context you need to analyze blue chip stocks through time, identifying patterns that shape investment outcomes. Explore our platform's interactive charts and AI-powered analysis to discover how today's blue chips compare to historical leaders and make more informed decisions for your portfolio.